


Blog
Real-Time Free Forex Technical Analysis Tool
Analysis Results
Real-Time Forex Technical Analysis Tool
Analyze major, minor, and exotic currency pairs in seconds. Powered by automated technical indicators, market sentiment evaluation, and price action pattern scanning—100% free and browser-based.
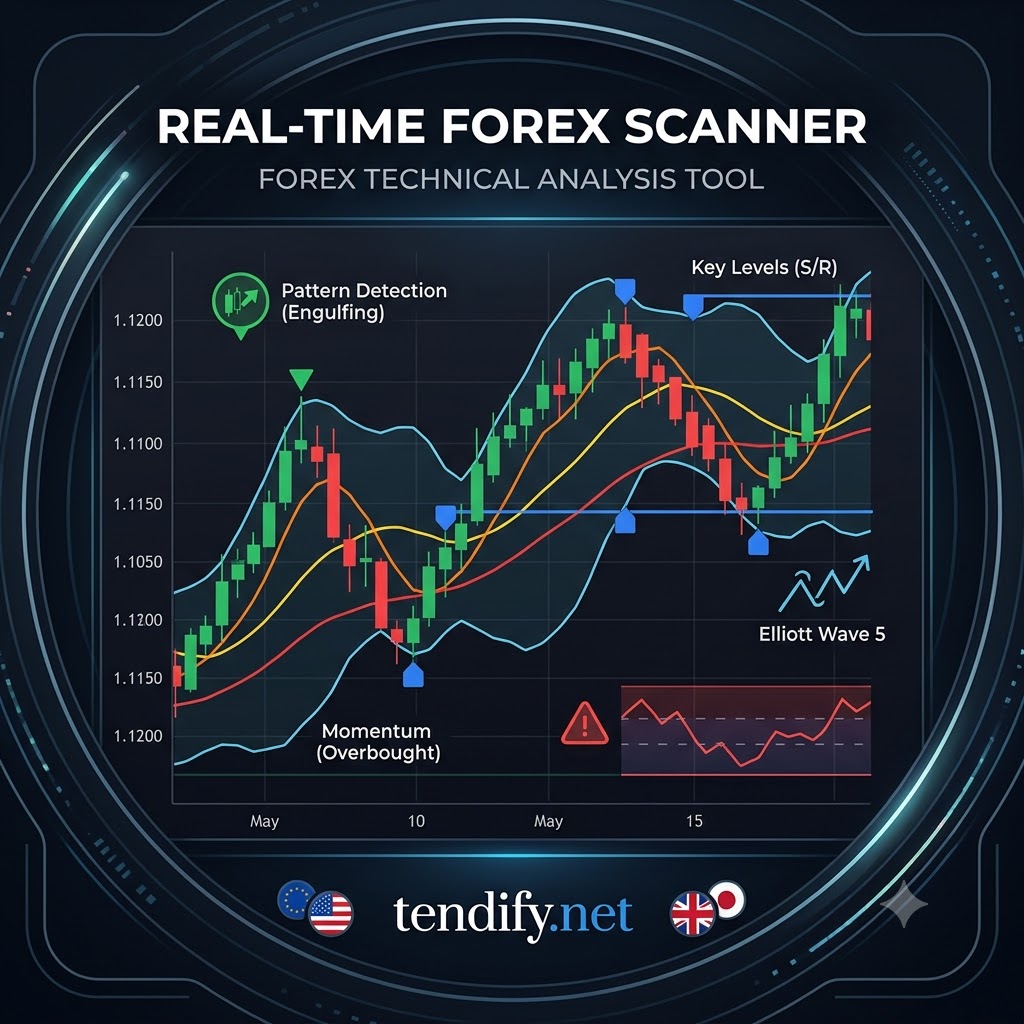
📈 Automated Price Action
Instantly scans candlesticks for high-probability patterns such as Doji, Hammer, Shooting Star, and Bullish/Bearish Engulfing signals.
⚙️ Multi-Indicator Engine
Integrates SMA (20, 50, 200), EMA 12, Bollinger Bands, RSI (14), and MACD crossovers to give you clear bullish or bearish insights.
🛡️ Key Levels & Zones
Automatically identifies classic Support & Resistance pivot points alongside volume-weighted Supply and Demand zones.
How to Use the Technical Scanner for Smarter Forex Trades
Navigating volatile foreign exchange markets requires fast, structured data evaluation. Whether you are a day trader scalping 5-minute charts or a swing trader reviewing daily candle formations, this tool consolidates core technical analysis metrics into one interactive interface.
1. Select Currency Pair and Timeframe
Choose from over 30 global Forex pairs grouped into Majors (EUR/USD, GBP/USD, USD/JPY), Crosses, and Exotics. Select your desired candle timeframe ranging from 1-minute intraday charts to daily and monthly trend horizons.
2. Interpret Technical Analysis Output
The right-hand panel automatically evaluates technical factors as soon as price data feeds into the lightweight charting canvas:
- Relative Strength Index (RSI): Detects potential market reversals by highlighting overbought conditions (above 70) or oversold levels (below 30).
- Moving Average Convergence Divergence (MACD): Tracks momentum momentum shifts via signal line crossovers.
- Pattern & Harmonic Scans: Scans structure setups including Head & Shoulders formations, Elliott 5-Wave cycles, and Gartley harmonic ratios.
Always look for confluence. A buy signal is significantly stronger when an oversold RSI aligns with a major Support level and a Bullish Engulfing candlestick on a higher timeframe.
Frequently Asked Questions (FAQ)
Is this Forex analysis tool completely free?
Yes. The Forex Technical Analysis Tool on Tendify runs entirely in your client web browser with zero API keys or subscriptions required.
Where does the market chart data come from?
Price quotes and historical candle distributions are sourced dynamically from real-time global financial data feeds.
Can I use this tool for crypto or stock markets?
This specific configuration focuses on major, minor, and exotic foreign exchange pairs. Check our main platform directory on Tendify for equity and crypto analysis suites.
About Eftekhari
From the Lab to the Global Market My journey began in the world of Chemical Engineering, where precision and optimization are everything. Today, as the CEO of Shayesteh Kar Rad Caspian and the founder of Tendify, I apply that same engineering mindset to the world of digital trade. I’ve transitioned from designing industrial processes to architecting digital marketplaces that serve the GCC and beyond. My expertise lies in blending "Engineering as Marketing" with a deep understanding of geopolitical market shifts. On Tendify, I share my insights and provide a platform designed for transparency and efficiency. I’m not just a developer; I’m a partner in your trade journey, committed to cutting through the noise with actionable, data-backed strategies.
View all posts by Eftekhari
