المدونة
Bitumen Price Index 2026: Understanding the Crude Oil Correlation

Essential Insights for Traders
I’ve been in the global trade game for over two decades now, starting from sourcing raw materials for construction projects back in my early thirties. One thing I’ve learned the hard way is that nothing shakes up the market quite like crude oil price swings. Picture this: You’re locked into a major infrastructure deal, budgeting for bitumen 60/70, and suddenly oil jumps 10%. Your costs spike, timelines stretch, and margins evaporate. It’s not just theory—it’s the reality I’ve faced on deals from road paving in emerging markets to waterproofing in industrial setups. In this comprehensive guide, we’ll dive deep into the impact of crude oil prices on the bitumen 60/70 price index, unpacking the “why” behind the fluctuations, historical patterns, and actionable strategies to stay ahead. Whether you’re a buyer, exporter, or investor, understanding this dynamic can mean the difference between profit and pain.

Crude Oil and Bitumen 60-70 Prices
Understanding Bitumen 60/70: The Backbone of Infrastructure
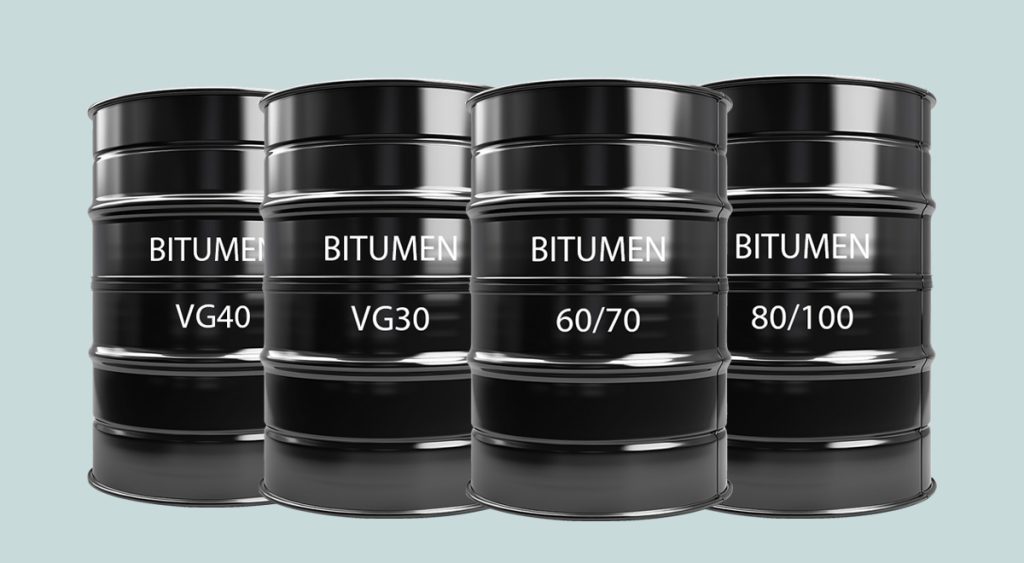
Bitumen 60/70 isn’t just another commodity—it’s the heavy-duty binder that holds our world together. As a penetration-grade bitumen, it’s defined by its softness and durability, with a penetration value between 60 and 70 at 25°C. This makes it ideal for high-traffic roads, roofing, and industrial applications where flexibility under varying temperatures is key.
Key Properties and Applications
- Durability in Harsh Conditions: It resists deformation in hot climates and cracking in cold ones, making it a go-to for asphalt mixes.
- Versatility Across Industries: From paving highways to sealing pipelines, bitumen 60/70 supports construction, oil and gas, and even waterproofing in buildings.
- Market Demand Drivers: Global infrastructure booms, especially in developing regions, fuel steady demand. Think mega-projects like urban expansions or port developments—these rely heavily on reliable bitumen supplies.
Why does this matter for the price index? Bitumen 60/70 is a direct derivative of crude oil, so its pricing isn’t isolated. When oil volatility hits, the bitumen market feels it immediately, affecting everything from procurement costs to project feasibility.
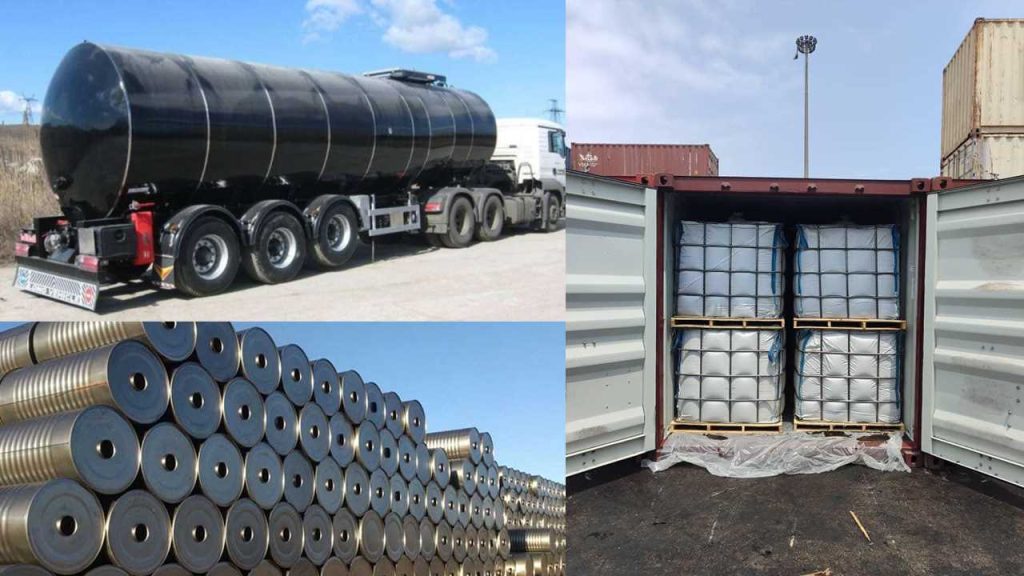
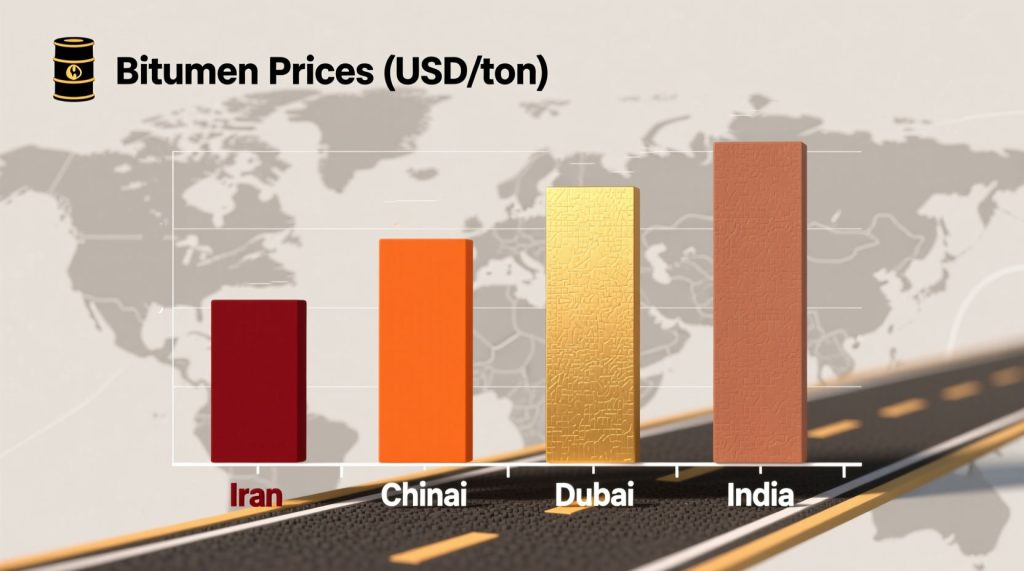
Global Production Hubs
Major producers include refineries in the Middle East, North America, and Asia. Supply chains here are intertwined with oil output, meaning any disruption ripples through the bitumen 60/70 price index. For traders, knowing these hubs helps anticipate regional price shifts.
The Production Link: How Crude Oil Directly Influences Bitumen 60/70 Pricing
Bitumen doesn’t appear out of thin air—it’s born from crude oil refining. Understanding this process reveals why oil prices dictate the bitumen 60/70 price index so profoundly.
Step-by-Step Production Process
- Crude Oil Distillation: Crude is heated to 300-350°C in atmospheric distillation towers, separating lighter fractions like gasoline from heavier residues.
- Vacuum Distillation: The bottom residue undergoes vacuum distillation to yield vacuum bottom (VB), the primary feedstock for bitumen.
- Air Blowing (Optional): For grades like 60/70, air is blown through the VB at high temperatures to adjust viscosity and penetration.
- Blending and Grading: Additives fine-tune properties, ensuring the final product meets 60/70 specs.
This chain means crude oil costs account for up to 70-80% of bitumen production expenses. A spike in oil directly inflates refining costs, pushing the bitumen 60/70 price index higher.
Economic Mechanics of the Link
- Cost Pass-Through: Refineries pass on oil price hikes to bitumen buyers, often with a lag of 1-3 months.
- Supply Elasticity: High oil prices encourage more refining, but if demand outpaces, bitumen shortages amplify price surges.
- Quality Variations: Heavier crudes yield more bitumen, so shifts in oil types (e.g., from light to heavy) influence output and costs.
In my experience, ignoring this link is a rookie mistake. I’ve seen deals unravel when oil dipped unexpectedly, flooding the market with cheap bitumen and undercutting planned sales.
Historical Correlations: Data-Driven Insights on Crude Oil and Bitumen Price Movements
Over the years, I’ve tracked patterns that show a clear correlation: For every 1% rise in crude oil, bitumen prices climb about 0.7%. Let’s break down the history to see the impact on the bitumen 60/70 price index.
Key Historical Trends
- 2000-2010 Boom: Oil surged from $30 to over $140 per barrel, driving bitumen prices up 150%. Infrastructure demands in Asia amplified this.
- 2014-2016 Crash: Oil plummeted to $30, slashing bitumen costs by 50%. Exporters scrambled, but it opened doors for budget projects.
- 2020 Pandemic Dip: Prices hit rock bottom at $20 for oil, with bitumen following suit—down 40%. Recovery in 2021-2022 saw a rebound tied to stimulus-driven builds.
- Post-2022 Volatility: Geopolitical tensions pushed oil to $90+, with bitumen 60/70 indexing similarly, fluctuating 20-30% yearly.
Data from sources like the U.S. Energy Information Administration highlights this: Bitumen volatility exceeds oil’s by 20-30%, due to its niche market.
Correlation Analysis Table
| Year Range | Average Crude Oil Price (USD/bbl) | Average Bitumen 60/70 Price Index (USD/ton) | Correlation Factor | Key Event Impact |
|---|---|---|---|---|
| 2010-2015 | 80-100 | 500-700 | 0.75 | Shale boom lowered oil, stabilizing bitumen |
| 2016-2020 | 40-60 | 300-450 | 0.68 | OPEC cuts spiked volatility |
| 2021-2025 | 70-90 | 450-600 | 0.72 | Post-COVID recovery and energy transitions |
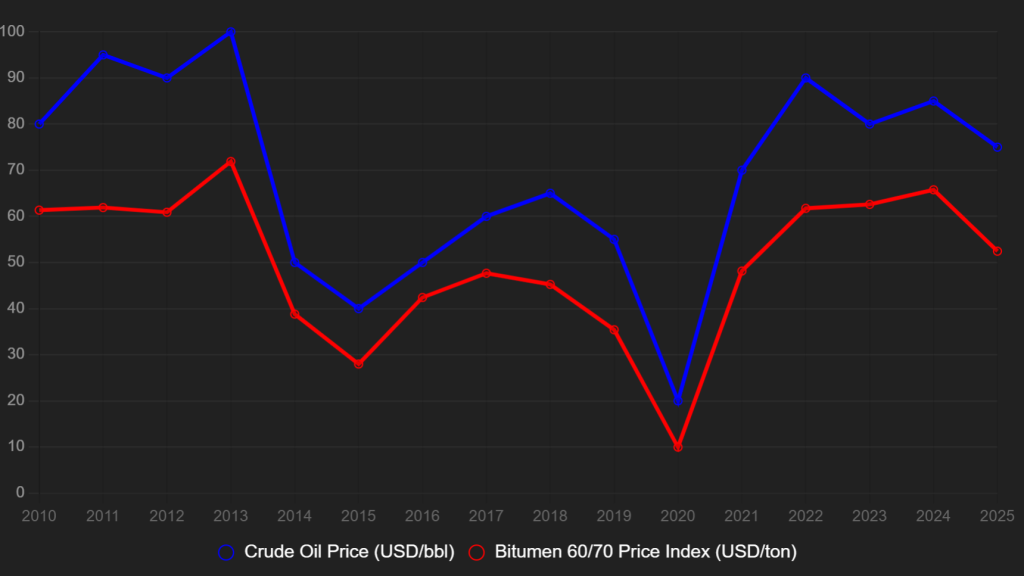
Crude Oil VS Birumen 60-70
Current Trends in 2025: Navigating Ongoing Crude Oil Volatility
As we wrap up 2025, crude oil hovers around $75-85 per barrel, influenced by OPEC+ cuts and renewable shifts. This has kept the bitumen 60/70 price index stable at $450-550 per ton, but with undertones of uncertainty.
2025 Market Snapshot
- Demand Surge in Asia and Africa: Infrastructure investments push bitumen needs up 5-7%, countering oil softness.
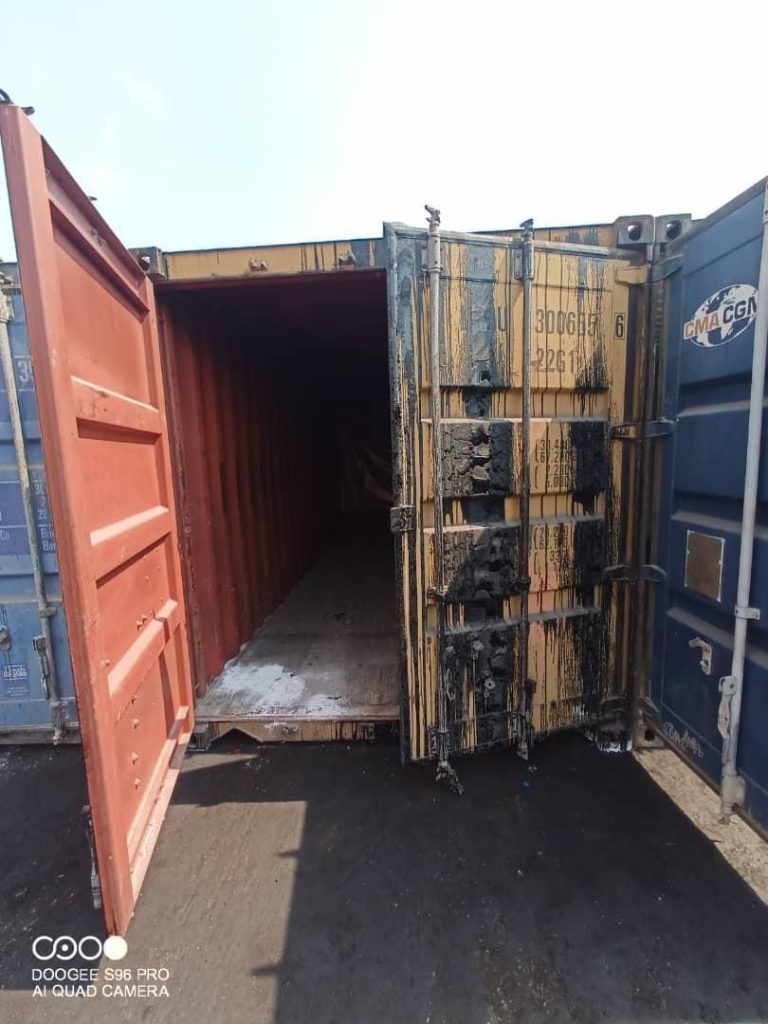
- Supply Chain Pressures: Red Sea disruptions add 10-15% to freight, indirectly boosting prices.
- Sustainability Push: Bio-bitumen alternatives emerge, but they’re 20% pricier, not yet displacing oil-derived 60/70.
Forecasts suggest a mild uptick if oil climbs to $90, with bitumen following at 0.7x ratio. For traders, this means monitoring Brent benchmarks daily.
Beyond Crude Oil: Other Factors Shaping Bitumen 60/70 Price Index
While crude oil is king, it’s not the only player. I’ve lost count of times when “secondary” factors blindsided my forecasts.
Critical Influences
- Currency Fluctuations: A stronger USD makes imports costlier for non-dollar economies, inflating local bitumen prices.
- Geopolitical Risks: Sanctions or conflicts disrupt supplies, as seen in recent MENA tensions.
- Freight and Logistics: Rising shipping costs add 5-10% to landed prices, especially for bulk exports.
- Regulatory Changes: Environmental tariffs on high-carbon materials could hike costs by 15% in the EU.
- Demand-Supply Imbalances: Oversupply from new refineries depresses prices, while seasonal construction peaks do the opposite.
For a deeper dive into regional differences affecting trade, check out our article on Understanding MENA, GCC, and Arab Countries: Key Regional Differences for Global Trade.
Case Studies: Real-World Impacts of Oil Price Fluctuations on Bitumen Markets
Theory is one thing; real cases drive the point home. Here’s how oil swings have reshaped bitumen 60/70 scenarios.
Case 1: 2014 Oil Crash
Oil dropped 50%, and bitumen prices followed, falling 40%. A major Asian road project saved 30% on materials but faced supplier shortages as refineries cut back. Lesson: Low oil creates buying opportunities but risks supply chain fragility.
Case 2: 2022 Geopolitical Spike
Oil hit $120 amid conflicts, pushing bitumen up 25%. An exporter I worked with hedged early, locking in profits while competitors scrambled. Impact: Projects delayed, costs overrun by 15-20%.
Case 3: 2020 Pandemic Volatility
Bitumen demand tanked with lockdowns, but quick recovery in 2021 saw prices rebound 50%. Traders who stockpiled low won big, emphasizing timing in volatile markets.
These examples show the bitumen 60/70 price index isn’t just reactive—it’s a barometer for broader economic health.
Strategies for Managing Price Volatility in Bitumen 60/70 Trading
After years of navigating this, here’s my direct advice: Don’t react; anticipate.
خطوات عملية قابلة للتنفيذ
- Hedging Tools: Use futures contracts on oil to lock in bitumen costs. Aim for 3-6 month horizons.
- Diversify Suppliers: Source from multiple regions to buffer regional shocks. Platforms like ours help connect verified ones.
- Data Monitoring: Track indices via tools like Trading Economics for real-time alerts.
- Long-Term Contracts: Negotiate fixed-price deals with escalation clauses tied to oil benchmarks.
- Inventory Management: Build buffers during lows, but avoid overstocking to prevent capital tie-up.
For financing these strategies, explore our guide on Pre-Shipment vs Post-Shipment Finance: The Ultimate Guide for Exporters.
In volatile corridors, see our insights on Transforming Trade Corridors in the Middle East 2026.
Wrapping Up: Turning Insights into Action
The impact of crude oil prices on the bitumen 60/70 price index is undeniable—it’s a direct, amplified relationship shaped by production ties, historical trends, and external forces. But with the right knowledge, it’s navigable. From my vantage as a seasoned trader, the key is blending data with instinct: Monitor oil closely, diversify risks, and act decisively.
Ready to secure stable bitumen 60/70 supplies amid these fluctuations? التسجيل on Tendify.net today—connect with verified global suppliers, post RFQs, and lock in deals that protect your bottom line. Join now and let’s build resilient trade together.