


وبلاگ
Iranian Urea Price Reality Check: $350 Offers vs $440 ME Benchmark
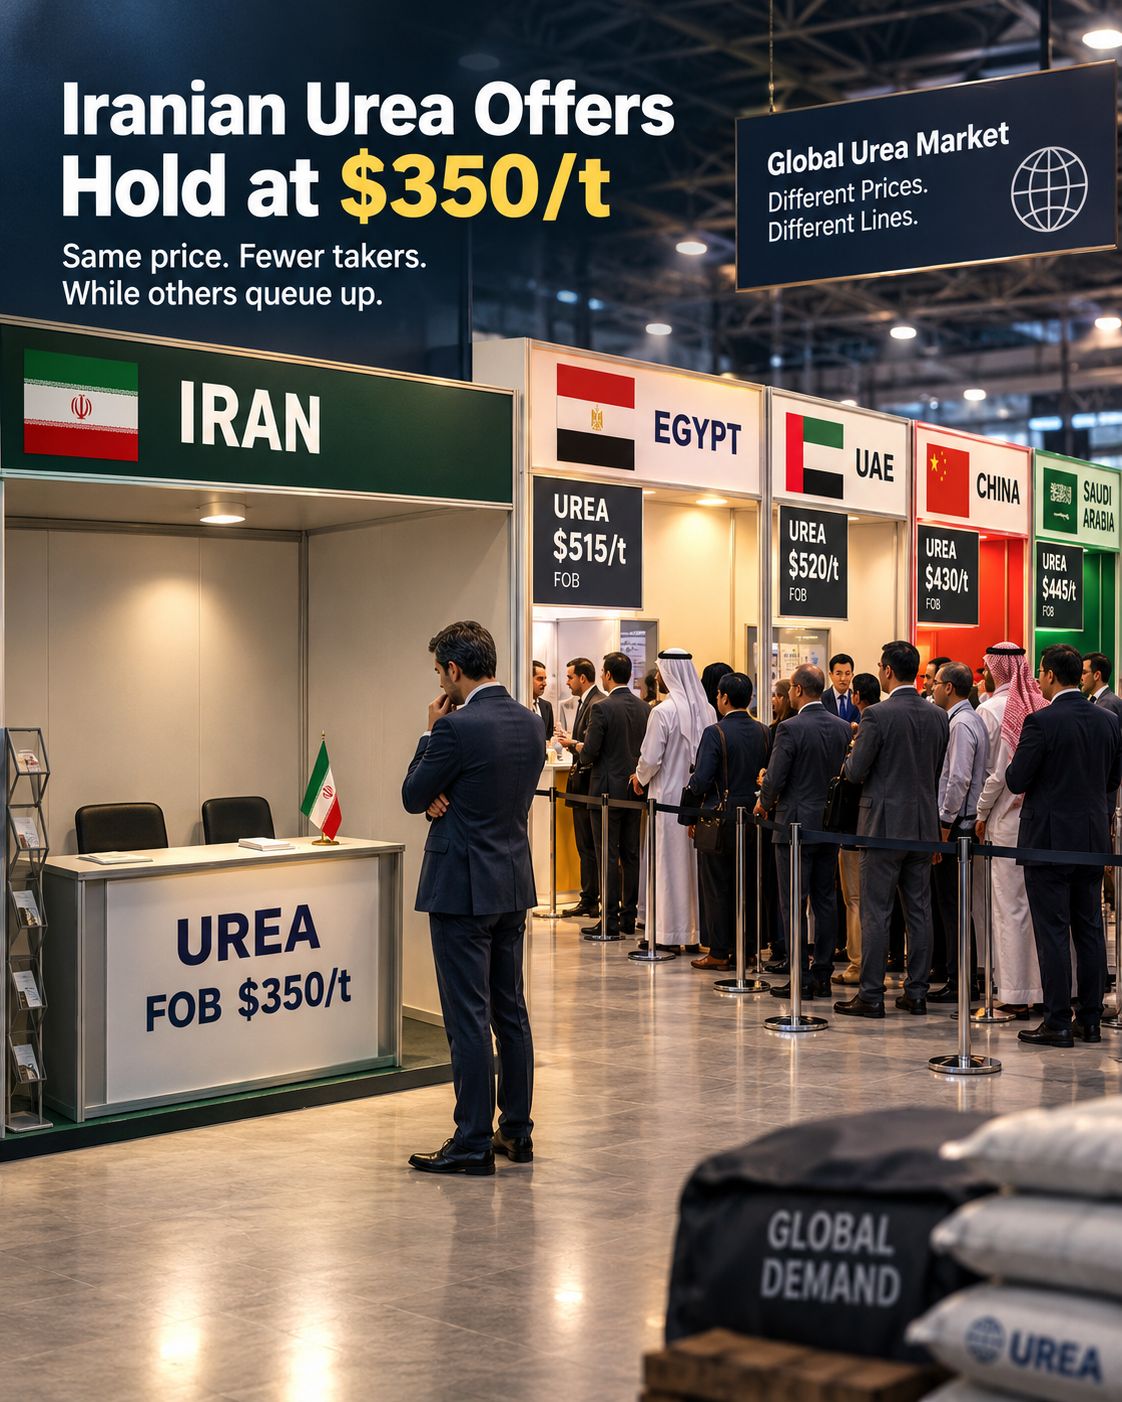
A $90 discount does not appear overnight. It builds when producer offers stay rigid, publication averages soften, and structural friction refuses to ease. In the latest assessment window, Iranian bulk granular urea offers remained locked at $350 per tonne FOB. At the same time the composite of major international publications fell $7 to $341.5 per tonne, and the broader Middle East average rose $5 to $440. The result is a clear widening of both the premium Iranian producers claim over published references and the discount those same offers carry against the regional benchmark.
This is no longer a one-week anomaly. It is the clearest current illustration of how payment restrictions, maritime logistics constraints, and limited transaction visibility continue to price Iranian cargoes at a structural disadvantage relative to other Middle East origins.
The Numbers That Matter This Week
Iranian producers kept official offers unchanged at $350/t FOB. The international publication average dropped $7 to $341.5/t. The premium of Iranian offers over that average therefore expanded from $1.5/t a week earlier to $8.5/t.
Assessment divergence was sharp:
- Argus moved higher, to $350–351/t.
- Profercy, CRU, WFM and ICIS all eased into the $325–350 range.
Meanwhile the Middle East average itself advanced $5 to $440/t. Because Iranian offers stayed flat, the discount to the regional benchmark widened from $85/t to $90/t. Iranian product is therefore losing relative ground inside its own region even while producers refuse to lower their posted numbers.

Iranian Urea Price Reality Check
These figures are not theoretical. They determine netbacks after freight, demurrage risk, bank confirmation costs and insurance loadings. Every extra dollar of discount compounds when vessels wait longer or when payment chains require additional confirmations.
Why Iranian Offers Are Holding While the Market Softens
Three operational realities keep Iranian pricing sticky at $350 while the rest of the market drifts lower.
Payment architecture remains the primary constraint.
Settlement routes for Iranian cargoes still pass through a narrow set of correspondent banks. Each additional confirmation layer adds both time and cost. When dollar liquidity tightens, those costs are absorbed almost entirely by the seller’s netback. Buyers who can structure clean, multi-bank confirmed letters of credit or alternative payment instruments extract better pricing; those who cannot simply walk away or demand deeper discounts.
Financial Levers: Non-USD Settlement Architecture (AED, RMB, INR)
To bypass dollar-clearing bottlenecks and reduce the heavy confirmation friction that drags down netbacks, sophisticated trading desks are increasingly restructuring settlement currencies away from USD:
- UAE Dirham (AED): Serves as the primary regional liquidity bridge in GCC trade, offering faster clearing times and significantly lower banking confirmation spreads.
- Chinese Yuan (RMB): Widely utilized for Asian destinations, unlocking bilateral trade channels and eliminating Western correspondent banking oversight.
- Indian Rupee (INR) Mechanisms: Deployed in specific Vostro/Nostro arrangements for Indian agricultural tenders, absorbing exchange-rate volatility while accelerating cash-flow velocity.
Maritime logistics continue to carry a friction premium.
Vessel availability into and out of Iranian load ports remains less predictable than at major GCC hubs. Charterers price in higher demurrage exposure and longer waiting times. Even when the physical cargo is ready, the combination of port congestion risk and elevated insurance premiums reduces the pool of buyers willing to pay full regional benchmarks.
Transaction visibility is still limited.
Many Iranian deals close bilaterally with minimal public reporting. Publication averages therefore lag actual done business. When the lag persists, the gap between what producers post and what the market will actually pay widens. The $8.5 premium over the publication average is the market’s current quantification of that information asymmetry.
Experiences across regional supply chains show these three factors rarely move independently. A five-day payment delay can force a vessel to wait, which then triggers demurrage that further erodes the FOB equivalent. The $90 discount to the Middle East average is simply the cumulative expression of that chain.
Supply Factor: Winter Gas Curtailments & Feedstock Cuts
Beyond banking and logistics frictions, market participants must factor in the impending seasonal supply squeeze. Historically, as regional temperatures drop in late Q4 and early Q1, domestic heating demand forces the diversion of natural gas away from industrial complexes.
For Iranian urea producers, this winter gas curtailment typically leads to reduced operating rates and localized plant turnarounds. The expectation of constrained spot availability over the coming weeks provides a structural rationale for producers to hold firm at their $350/t FOB headline offers, anticipating that tightening local supply will absorb international publication softness.
Global Context: Energy Benchmarks (TTF/Henry Hub) & North African Competition
Evaluating Middle East pricing requires a glance at global marginal production costs driven by feedgas values. While US Henry Hub remains range-bound, fluctuations in European TTF natural gas futures directly dictate operating economics for European producers and heavily influence North African (Egyptian and Algerian) netbacks.
North African granular urea offers typically command a freight premium into European and Latin American destinations compared to GCC origins. When North African FOB levels stay supported by higher European gas cost floors, Middle East sellers comfortably leverage their $440/t FOB ceiling. For Iranian exporters, this global cost structure reinforces that the $90 discount is entirely driven by origin-specific structural friction rather than a collapse in global urea manufacturing margins.
Practical Pricing Discipline for Iranian Cargoes
Exporters sitting on $350 offers face a binary choice: hold the official number and accept slower sales velocity, or adjust closer to the publication composite to move volume. The second path is not pure concession. It is a deliberate trade of headline margin for cash-flow speed and inventory turnover.
A working method used by several active desks this season:
- Calculate the true netback after estimated demurrage (currently averaging 4–8 days on constrained load ports), bank confirmation fees (often 0.8–1.5 percent), and insurance loadings.
- Compare that netback against the most recent Argus mid-point and the Profercy/CRU range rather than the official $350 offer.
- Offer a time-limited firm volume at a level that still clears the adjusted netback while remaining competitive with North African and Chinese alternatives.
Seasonal Supply Constraints & The Gas Factor
As Q4 progresses, market participants must also factor in the impending winter gas curtailments affecting Iranian urea complexes. Historically, feedstock diversion to the domestic heating grid reduces overall plant operating rates across Southern Iran during late Q4 and early Q1.
This seasonal contraction in available export volume partially explains why producers feel comfortable holding posted offers at $350/t FOB—expecting tighter spot supply to support prices locally, even as global publication averages drift.
Importers should treat the $440 Middle East average as a ceiling, not a floor. The deeper discount available on Iranian cargoes creates opportunity for buyers who can handle documentation complexity and slightly longer delivery windows. The key is to lock the discount in writing with clear demurrage-sharing clauses, pre-agreed force-majeure language around payment delays, and precise quality and packaging specifications.
Regional Benchmark Snapshot (Mid-October 2026)
| Reference | Level ($/t FOB) | Change vs Prior Week | Implication for Iranian Cargoes |
|---|---|---|---|
| Iranian producer offers | 350 | Unchanged | Official resistance level |
| Publication composite average | 341.5 | –7 | Soft floor reflecting actual liquidity |
| Argus | 350–351 | شرکت | Closest to official Iranian numbers |
| Profercy / CRU / WFM / ICIS | 325–350 | Soft | Reflects risk pricing and limited visibility |
| Middle East average | 440 | +5 | Regional ceiling for clean GCC cargoes |
| Iranian discount to ME average | 90 | Widened from 85 | Structural friction cost |
The table makes the strategic choice visible. Cargoes that can demonstrate cleaner banking channels and more predictable load windows continue to achieve closer to the $440 marker. Everything else trades nearer the publication range.
Market Catalyst: Indian Tenders (IPL / RCF) & Regional Price Discovery
While Middle East benchmarks hover at $440/t FOB and publication composites soften, the ultimate direction of global liquidity hinges on India. Major purchasing agencies like India Potash Limited (IPL) and Rashtriya Chemicals & Fertilizers (RCF) remain the primary volume anchors capable of absorbing surplus Middle Eastern and Asian tonnage.
The anticipation of an upcoming Indian import tender sets a psychological floor for sellers. For Iranian producers, India represents a vital destination market where discount-to-benchmark dynamics actively play out. A large-volume Indian award at firm prices could quickly eliminate publication composite drag, whereas a subdued tender result will amplify buyer pressure on Iranian desks to align closer to $330–340/t FOB netbacks.
Logistics and Documentation Levers That Narrow the Gap
The most effective operators treat documentation as a pricing tool. Pre-cleared certificates of origin, consistent quality certificates aligned with destination requirements (particularly for India, Brazil, Turkey and East Africa), and advance vessel nomination reduce the risk premium buyers assign. In recent fixtures the difference between a full, clean paper package and a standard package has been worth $12–20 per tonne in final netback.
Freight selection also matters more than usual. Spot charter rates into constrained load ports remain elevated. Fixed-window contracts with demurrage caps have proven more profitable than pure spot even when the absolute freight rate looks higher on paper. Schedule certainty allows sellers to compress the discount they must offer.
Destination Analysis: Freight Spreads & Route Arbitrage
FOB realizations for Iranian tonnage are heavily tied to route-specific freight premiums. The tiering of available tonnage between compliant fleets and non-sanctioned charter markets creates distinct freight spreads across primary export corridors:
- West Coast India (WCI): Remains the shortest, most liquid leg. Lower voyage duration limits demurrage exposure, keeping freight differentials manageable and allowing sellers to capture higher netbacks.
- East Coast Brazil (ECB): Involves long-haul ocean passages where insurance loadings and vessel positioning costs expand the freight gap by $15–25/t compared to clean GCC fixtures.
- Turkey & East Africa: Regional spot demand offers good netbacks, but port congestion and strict documentation windows necessitate pre-vetted tonnage to avoid severe demurrage penalties.
For teams that need real-time visibility across vessel positions, HS-code compliance and indicative duty calculations, operational layers that aggregate these data points shorten the time between offer and firm booking. One such layer available to registered users is Platform.Tendify.Net.
What Would Actually Close the $90 Discount
Two developments would compress the gap. First, any sustained improvement in correspondent banking capacity for Iranian origins would immediately reduce the payment friction premium. Second, a sustained period of lower vessel waiting times and more predictable load-port performance would lower the logistics risk premium. Until one or both occur, the $90 differential is the working assumption for the remainder of Q4 2026 and into early 2027.
Buyers should therefore budget on the basis of the publication composite plus a modest risk buffer rather than the regional average. Sellers should decide in advance whether volume velocity or headline price is the priority for each cargo. Mixing the two approaches across a portfolio—holding firm on cleaner parcels while moving more constrained parcels closer to market—has produced the most consistent results this cycle.
Action Checklist for the Next 30 Days
- Recalculate every open Iranian offer against the latest Profercy, CRU and Argus mid-points, not last month’s internal target.
- Insert explicit demurrage-sharing language and clear payment-timeline clauses into every new contract.
- Pre-clear documentation packages for the three most likely destination markets (currently India, Brazil and Turkey show the strongest demand signals).
- Compare the all-in cost of a slightly higher freight rate with schedule certainty against the pure spot alternative.
- Monitor the next major Indian tender closely; it remains the single largest demand event capable of shifting the entire publication average in one week.
The Iranian urea market in late 2026 rewards precision over optimism. The $350 official offer is real. The $90 discount to the Middle East average is equally real. Traders who measure both accurately, and adjust contracts, logistics and documentation accordingly, will protect margin while others are still arguing about which number is “correct.”
Turn Pricing Signals into Executable Deals
For trading desks and supply chain teams looking to streamline international trade without adding operational headcount, Platform.Tendify.Net bridges the gap between market data and execution.
Proforma & Contracts
Automated international B2B documentation & clause management.
Logistics Calculators
Real-time landed cost, demurrage risk & netback estimators.
Compliance & Tariff
HS-code verification and MENA customs clearance workflows.
سوالات متداول (FAQ)
Key market insights on Iranian granular urea pricing & export mechanics
Why is Iranian granular urea priced at a $90 discount to the Middle East benchmark?
The $90/t discount against the $440/t GCC benchmark is a cumulative reflection of structural friction. It accounts for higher correspondent banking fees, limited vessel availability into load ports, demurrage exposures, elevated marine insurance loadings, and reduced public transaction visibility.
Will winter gas curtailments cause Iranian producers to raise or lower export offers?
Winter gas cutbacks divert feedstock away from petrochemical complexes toward domestic residential heating, reducing urea plant operating rates. This seasonal supply contraction provides producers with a rationale to resist lower price bids and hold firm at $350/t FOB, expecting tighter spot volume to balance market weakness.
How do alternative currencies (AED, RMB, INR) affect netback realizations?
Settling trades in non-USD currencies bypasses Western correspondent bank bottlenecks and reduces confirmation spreads. Switching to UAE Dirhams (AED) or Chinese Yuan (RMB) allows trading desks to recover an estimated $5–10 per tonne in absorbed financial friction fees.
Which export destinations yield the highest netbacks for Iranian urea cargoes?
West Coast India (WCI) typically provides the tightest netback due to shorter voyage times and lower freight premiums. Long-haul voyages to East Coast Brazil incur an additional $15–25/t in freight, insurance, and chartering spreads, requiring deeper FOB price concessions.

