


وبلاگ
Oil Price Forecasts 2026: Goldman Sachs’ Brent Target & Trade Costs

Goldman Sachs Raises Oil Price Forecasts: What Brent Toward $140 Means for Cross-Border Trade Costs and Logistics in 2026-2027
Brent crude trades near $109–111 per barrel in early November 2026 after a sharp October rally. Goldman Sachs has just lifted its December 2026 Brent target to $105 (from $90) and its 2027 average to $88 (from $80). The bank’s upside case sees Brent averaging around $130 and potentially touching $140 if Gulf production stays 3.5 million barrels per day below 2025 levels. The downside case, with fuller supply recovery and reduced disruption risk, points toward the $60s. A base-case allowance now includes roughly 1 million barrels per day of global supply disruption risk into 2027.
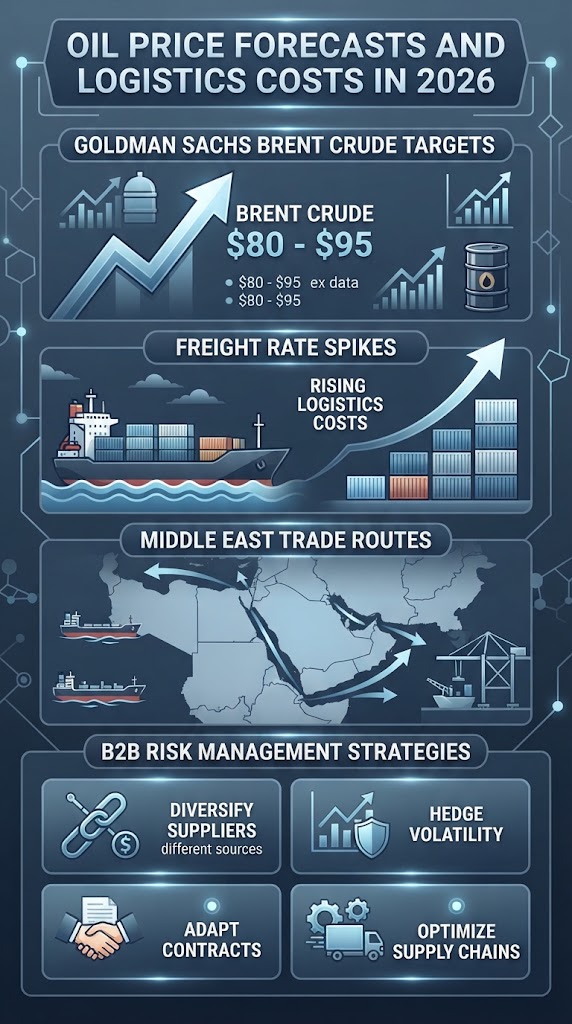
Oil Price Forecasts 2026
The $27 risk premium that Goldman attributes to October’s move is not abstract. It is already visible in tanker rates that have jumped roughly sevenfold on key routes, war-risk insurance, ship-to-ship transfer costs, and longer voyage times. For B2B traders moving bulk commodities, construction materials, chemicals, or finished goods through GCC ports and into Asia, Europe, or Africa, this is not a commodity-desk story. It is a landed-cost, margin, and contract-risk story.
This piece breaks down the forecasts, quantifies the logistics transmission channels, and lays out practical responses that operators can implement without waiting for diplomatic clarity.
What Goldman Actually Changed and Why It Matters Now
Goldman’s revision rests on three observations. First, physical adaptation has restored a large share of Middle East volumes, yet market participants continue to price a persistent downside risk to regional supply. Second, the length of prior major supply shocks and the difficulty of locking in a durable political settlement keep the risk premium elevated. Third, the bank has explicitly added a 1 million barrel-per-day disruption allowance into its 2027 base case.
The upside scenario is mechanical: sustained Gulf output 3.5 million barrels per day below the 2025 average produces average Brent near $130 with spikes to $140. The downside assumes faster recovery and the risk premium collapsing, taking prices into the $60 range. Spot levels already sit above the new December target, which tells you the market is currently leaning toward the higher-risk distribution.
For trade operators the relevant question is not the headline price but the second-order effects: freight, insurance, bunker, demurrage exposure, and the speed at which higher energy costs feed into manufacturing and construction input prices across the GCC and wider MENA.
Freight and Insurance Have Become First-Order Cost Drivers
Before the recent escalation cycle, crude freight typically represented a few percent of delivered cost. On Middle East-to-Asia VLCC routes that share has ballooned. Average global crude freight has moved above $20 per barrel from roughly $3 a year earlier; some Gulf-to-Asia legs have exceeded $35–37 per barrel. War-risk premia, higher bunker prices, and the operational drag of ship-to-ship transfers outside traditional loading zones account for the bulk of the increase.
These costs do not disappear when crude is refined or when products move inland. Product tankers face similar capacity constraints. Longer voyages and higher day rates tighten the availability of vessels for non-Gulf trades as well. Atlantic Basin barrels become relatively more expensive to move east, while Gulf barrels carry a heavier logistics surcharge even when the crude itself is discounted by producers trying to keep volumes flowing.
For a trader shipping 50,000-tonne parcels of bitumen, base oils, polymers, or construction steel, a $15–25 per-barrel equivalent freight swing is material. It changes the viability of CFR versus FOB structures, the attractiveness of alternative load ports, and the size of the buffer that must be built into fixed-price contracts.
Chokepoints, Alternative Ports, Pipelines & Fleet Breakdown
1. Critical Maritime Chokepoints
The risk premium is heavily concentrated around vital global maritime gates. The Strait of Hormuz remains the primary vulnerability for Gulf crude and petrochemical outflows. Meanwhile, security escalations impacting Bab el-Mandeb and the Red Sea continue to force operators away from the Suez Canal route, diverting vessels around Africa’s Cape of Good Hope. This Cape diversion adds 10 to 14 days transit time per leg, instantly locking up vessel capacity and inflating ton-mile demand.
2. GCC & Regional Alternative Ports: Risk vs. Cost
To bypass high-risk zones or alleviate localized congestion, traders are re-evaluating load and transshipment hubs:
- Fujairah & Khor Fakkan (UAE): Prime bunkering and bypass hubs located outside the Strait of Hormuz, though regional spillover risks elevate insurance costs.
- Jebel Ali & Hamriyah (UAE): Major container and bulk gateways facing high demand, requiring tighter scheduling to avoid berth demurrage.
- Salalah & Duqm (Oman) / King Abdullah Port (Saudi Arabia): Strategic Red Sea and Arabian Sea alternatives that bypass Gulf chokepoints entirely, though connected via longer overland or pipeline logistics.
3. Pipeline Mitigation: East-West Pipeline, ADCOP & SPR
Strategic infrastructure provides partial relief. Saudi Arabia’s East-West Pipeline (Petroline) to Yanbu and the UAE’s Abu Dhabi Crude Oil Pipeline (ADCOP) to Fujairah allow crude to bypass Hormuz. However, their physical capacity is finite, and downstream Red Sea loading points face their own security premiums. Concurrently, coordinated draws from Strategic Petroleum Reserves (SPR) act as short-term price shock absorbers but do not resolve maritime transport bottlenecks.
4. Impact Breakdown Across Fleet Segments & Overland GCC
The logistics shock transmits differently across transport modes:
- VLCCs (Very Large Crude Carriers): Heavily impacted by charter rate volatility and risk surcharges on Middle East export routes.
- Product Tankers: Face severe regional capacity constraints for refined fuels, polymers, and liquid chemicals (e.g., base oils and bitumen).
- Container & Dry Bulk: Suffer from cascading schedule reliability issues, equipment imbalances, and rising bunker surcharges.
- GCC Overland Trucking: Cross-border road transport within the GCC absorbs higher diesel prices and border clearance friction, raising intra-regional landed costs.
Transmission Channels into B2B Supply Chains
Higher oil prices and elevated logistics costs hit GCC and regional B2B activity through several simultaneous channels:
Key Industry Insight
Direct Impact on Petrochemical and Chemical Markets (The Core of Regional Trade)
While bitumen and polymers are key benchmarks, special attention must be paid to Middle Eastern petrochemical long-term contracts (Term Contracts) and the vulnerability of pricing formulas tied to Contract Prices (CP) or FOB Persian Gulf terms. When maritime freight rates spike by up to sevenfold, legacy pricing formulas can inadvertently squeeze margins or render traditional buyer-seller risk-sharing agreements financially unsustainable.
- Direct energy and feedstock costs. Refineries, petrochemical plants, and energy-intensive manufacturers face higher input bills. These feed into prices for plastics, fertilizers, asphalt, and industrial chemicals that are major export and re-export categories.
- Maritime and inland transport inflation. Container and bulk freight rates respond to bunker costs and vessel scarcity. Last-mile and cross-border trucking within the GCC also feels the diesel price effect.
- Working-capital and inventory pressure. When freight and demurrage risk rise, buyers and sellers both tend to hold more buffer stock or demand shorter payment terms, stretching balance sheets.
- Contract and Incoterm friction. Force-majeure and price-adjustment clauses that once felt routine now carry real economic weight. Buyers push for FOB or tighter delivery windows; sellers resist absorbing open-ended logistics exposure.
- Secondary demand effects. Higher global energy costs slow industrial activity in major import markets, which can eventually soften demand for GCC-origin intermediate goods even if local production remains competitive.
Experiences in regional supply-chain analysis show that the operators who treat these channels as discrete and sequential usually under-hedge. The interactions compound.
Practical Playbook for Traders and Logistics Managers
- Re-price every live and near-term contract with explicit logistics sensitivity.
Model the impact of a sustained $20–30 per-barrel freight environment on current Incoterms. Convert vague “subject to freight” language into clear adjustment formulas or hard caps. For bulk liquids and solids, quantify the demurrage and detention exposure under slower port turns or longer waiting times. - Stress-test alternative load and discharge options.
Where volumes allow, compare traditional Gulf load ports against alternative Gulf or Red Sea options that reduce exposure to the highest-risk transit segments. Evaluate whether dual-sourcing or partial inventory positioning in free-zone or bonded facilities lowers overall risk-adjusted cost. Tools that map real-time vessel availability and route intelligence become more valuable when the conventional schedule reliability breaks down. - Lock or hedge the controllable pieces of the cost stack.
Bunker hedges, freight futures or options where liquid markets exist, and structured trade-finance products that incorporate logistics contingency lines can reduce the open-ended nature of the exposure. For many mid-sized traders the practical route is a combination of fixed-price freight contracts for core volumes plus selective optionality for the swing portion. - Tighten documentation and compliance discipline.
Elevated risk environments increase scrutiny on valuation, origin, and sanctions screening. Incomplete or inconsistent paperwork that previously caused only delays now risks costly holds when vessel schedules are already stretched. Export documentation checklists and HS-code verification tools reduce avoidable friction. - Build scenario-based inventory and cash-flow buffers.
Run the business under three oil/freight regimes: the Goldman base case, the $130–140 upside, and a faster normalization. Translate each into required working-capital days and safety-stock levels. Operators who wait for the high-price scenario to materialize before adjusting inventory policy usually pay the highest carrying or stock-out costs. - Review counterparty and route concentration.
Single-load-port or single-carrier dependency becomes more expensive when disruption probability rises. Diversifying across a small set of reliable logistics partners and, where possible, across complementary trade corridors lowers the chance that one localized event freezes the entire flow.
Practical Strategy
Access to Financial Markets & Realistic Hedging Tools in MENA
While financial hedging is standard practice, mid-sized operators across the MENA region often face structural banking and foreign exchange constraints when accessing oil and derivatives markets. Instead of complex futures instruments, practical risk mitigation relies on localized alternatives: domestic forward contracts, barter/countertrade frameworks, or shifting from rigid long-term commitments to shorter-term contracts with mandatory monthly price reviews.
Implications for Specific Trade Categories
Bulk bitumen and related road-construction materials illustrate the transmission clearly. Freight and heating costs form a larger share of delivered price than for many dry bulk commodities. A sustained high-freight environment compresses margins on long-haul Asian or African trades unless sellers can pass costs through or shift to shorter-haul or re-export models via Gulf free zones. Similar dynamics apply to base oils, certain polymers, and energy-intensive construction materials that feed Saudi and UAE project pipelines.
Machinery and project cargo face a different but related problem: higher energy costs raise the operating expenses of end-users, which can slow order intake even while logistics costs on the export side are rising. The net effect is often a temporary margin squeeze that rewards firms with flexible production scheduling and diversified geographic demand.
Using Digital Tools to Compress Reaction Time
Real-time visibility into vessel positions, port congestion, and route risk is no longer a nice-to-have. Platforms that aggregate market pulse data, sanctions screening, and logistics optimization reduce the lag between a price or freight spike and an operational response. For firms already using structured trade workflows, integrating HS-code, duty, and cost calculators with live freight intelligence shortens the cycle from market move to revised offer.
One practical application is continuous landed-cost modeling. When freight and insurance swing by double-digit percentages within a month, static spreadsheets lag. Dynamic tools that refresh key cost components allow sales and procurement teams to adjust quotes and purchase decisions inside the same commercial cycle rather than the next one.
Methodology & Data
Data Sources, Benchmark Nuances & Scenario Methodology
1. Goldman Sachs Report & Key Metric Attribution
Based on Goldman Sachs Commodities Research publications released in early November 2026. The projections incorporate a revised December 2026 Brent target of $105/bbl and a 2027 average of $88/bbl. The figures cited—including the $27 geopolitical risk premium, the surge in global crude freight from ~$3/bbl to over $20/bbl (with specific Middle East-to-Asia VLCC legs touching $35–37/bbl), and a sevenfold jump in key tanker rates—reflect spot market assessments and tanker tracking indices during the October–November 2026 escalation window.
2. Regional Benchmarking: Brent vs. Dubai/Oman Differentials
While global headlines focus on Brent, physical trade operations across the Gulf Cooperation Council (GCC) and MENA region rely primarily on Dubai/Oman benchmarks and official selling prices (OSPs), alongside regional crude differentials. When freight and insurance costs surge, these differentials absorb localized pressures, meaning landed-cost variations often diverge from headline Brent shifts.
3. Scenario Assumptions & Probability Framework
The upside case assumes sustained Gulf production losses of 3.5 million barrels per day (mb/d) below 2025 averages, driving Brent toward $130–140. The base case integrates a persistent 1 mb/d global supply disruption allowance extending through 2027. The downside case ($60s range) assumes rapid supply restoration and full risk-premium compression.
Disclaimer & Notice
This analytical overview is for informational and B2B operational risk-management purposes only. It does not constitute financial, investment, or trading advice. Commodity forecasts and freight rates are inherently volatile and subject to rapid geopolitical and macroeconomic shifts.
Positioning for the Range of Outcomes
The market can still resolve toward lower prices if supply recovery accelerates and the risk premium compresses. It can also stay elevated or move higher if disruption risks materialize more fully. The operational response that works across the range is the same: explicit quantification of logistics exposure, clearer contract language, selective hedging of the controllable variables, and faster information loops.
Firms that treat the current environment as a temporary spike and wait for “normal” freight rates to return risk locking in uncompetitive cost structures for the next several quarters. Those that re-engineer the cost stack now—route options, inventory policy, Incoterm discipline, and digital visibility—will be better positioned whether Brent averages closer to $90 or tests the upper end of Goldman’s range.
The oil price is only the headline. The real margin impact travels through freight, insurance, working capital, and contract design. The firms that map and manage those channels deliberately will treat the current volatility as a competitive filter rather than an external shock.

