


Blog
African Trade Corridors: 5 Freight & Customs Pitfalls to Avoid

Most exporters treat the port as the decisive moment in the trade chain. They negotiate vessel slots, track berth productivity, and celebrate when a container clears the terminal in under 48 hours. That focus is incomplete.
Africa’s trade friction is not primarily a port problem. It is a corridor and border problem. A container can move through a high-performing gateway and still lose days or weeks because of customs delays, weak road or rail links, border congestion, cargo-security risks, or fragmented corridor governance. Gateway competitiveness cannot be measured by port throughput alone.
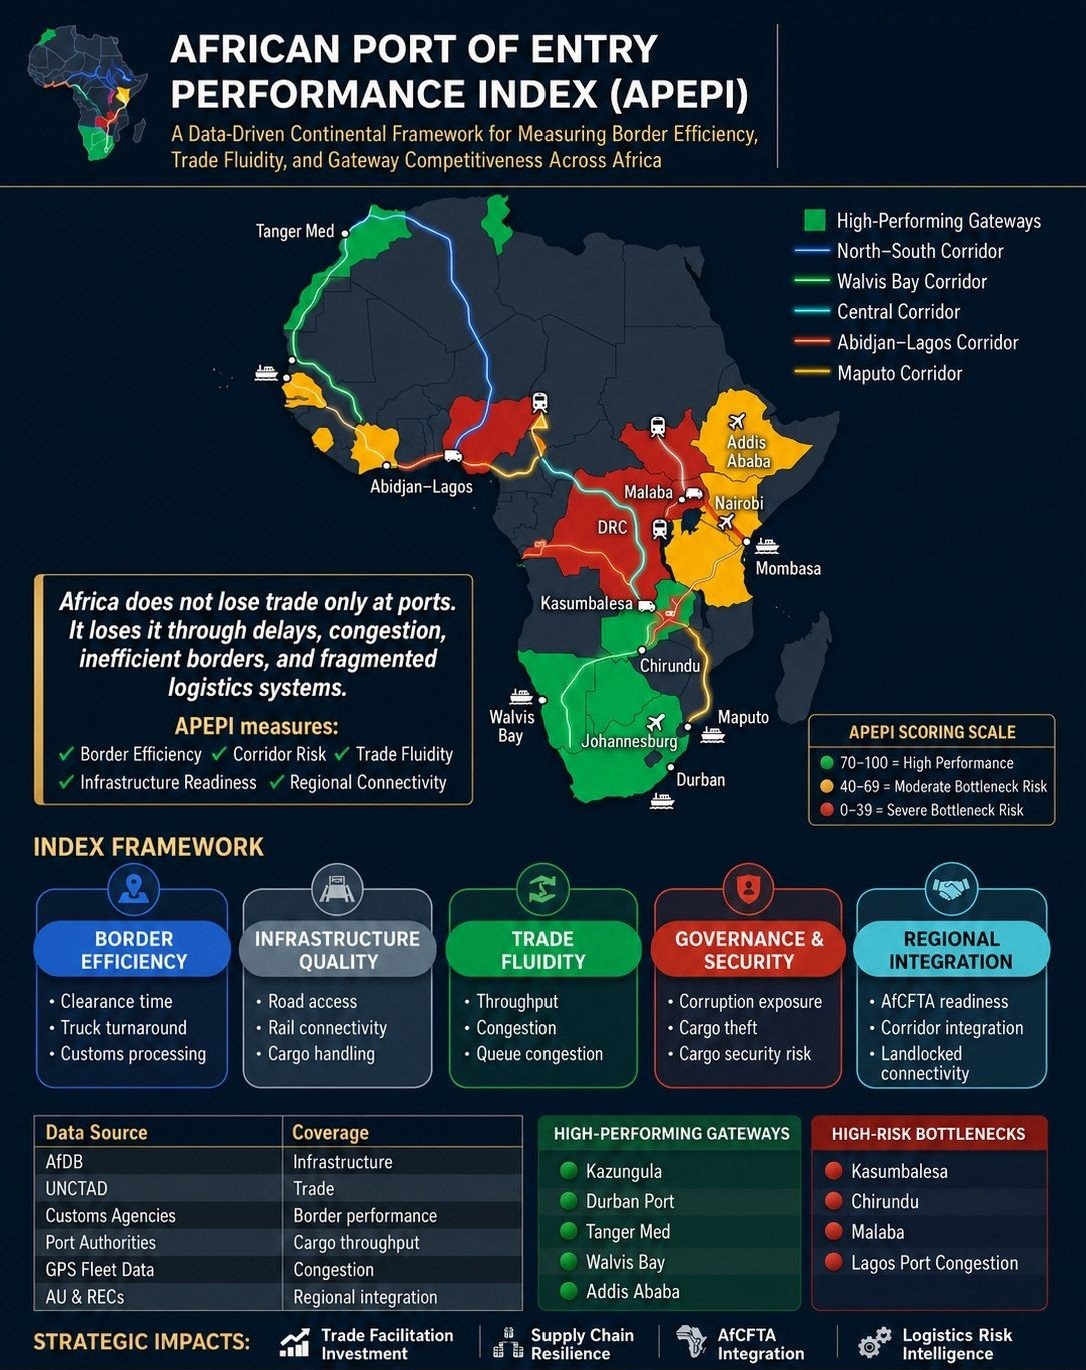
The African Port of Entry Performance Index (APEPI) offers a sharper lens. It shifts attention from isolated port metrics to the full gateway system through which goods, capital, and economic activity actually move. APEPI examines five dimensions:
- Border Efficiency — clearance times, truck turnaround, and customs processing speed
- Infrastructure Quality — road, rail, and cargo-handling capacity along the hinterland route
- Trade Fluidity — throughput, congestion patterns, and queue management
- Governance & Security — corruption exposure, cargo theft risk, and overall security conditions
- Regional Integration — AfCFTA readiness, corridor coordination mechanisms, and connectivity for landlocked markets
These dimensions answer a more useful question: Where does African trade actually lose time, reliability, and competitiveness? The answer is rarely confined to the quay.
High-performing gateways such as Tanger Med, Durban (when operating smoothly), Walvis Bay under better conditions, and key East African one-stop border posts show what becomes possible when infrastructure, border management, and regional connectivity reinforce one another. Bottlenecks at places such as Kasumbalesa, Chirundu, Malaba, and sections of the Lagos corridor demonstrate how weakness at a single strategic node transmits cost and delay far beyond the border itself.
Infrastructure investment should therefore be judged by a different standard. The relevant metric is not kilometres of road or tonnes of port capacity added. It is how much friction the investment removes from the end-to-end trade corridor.
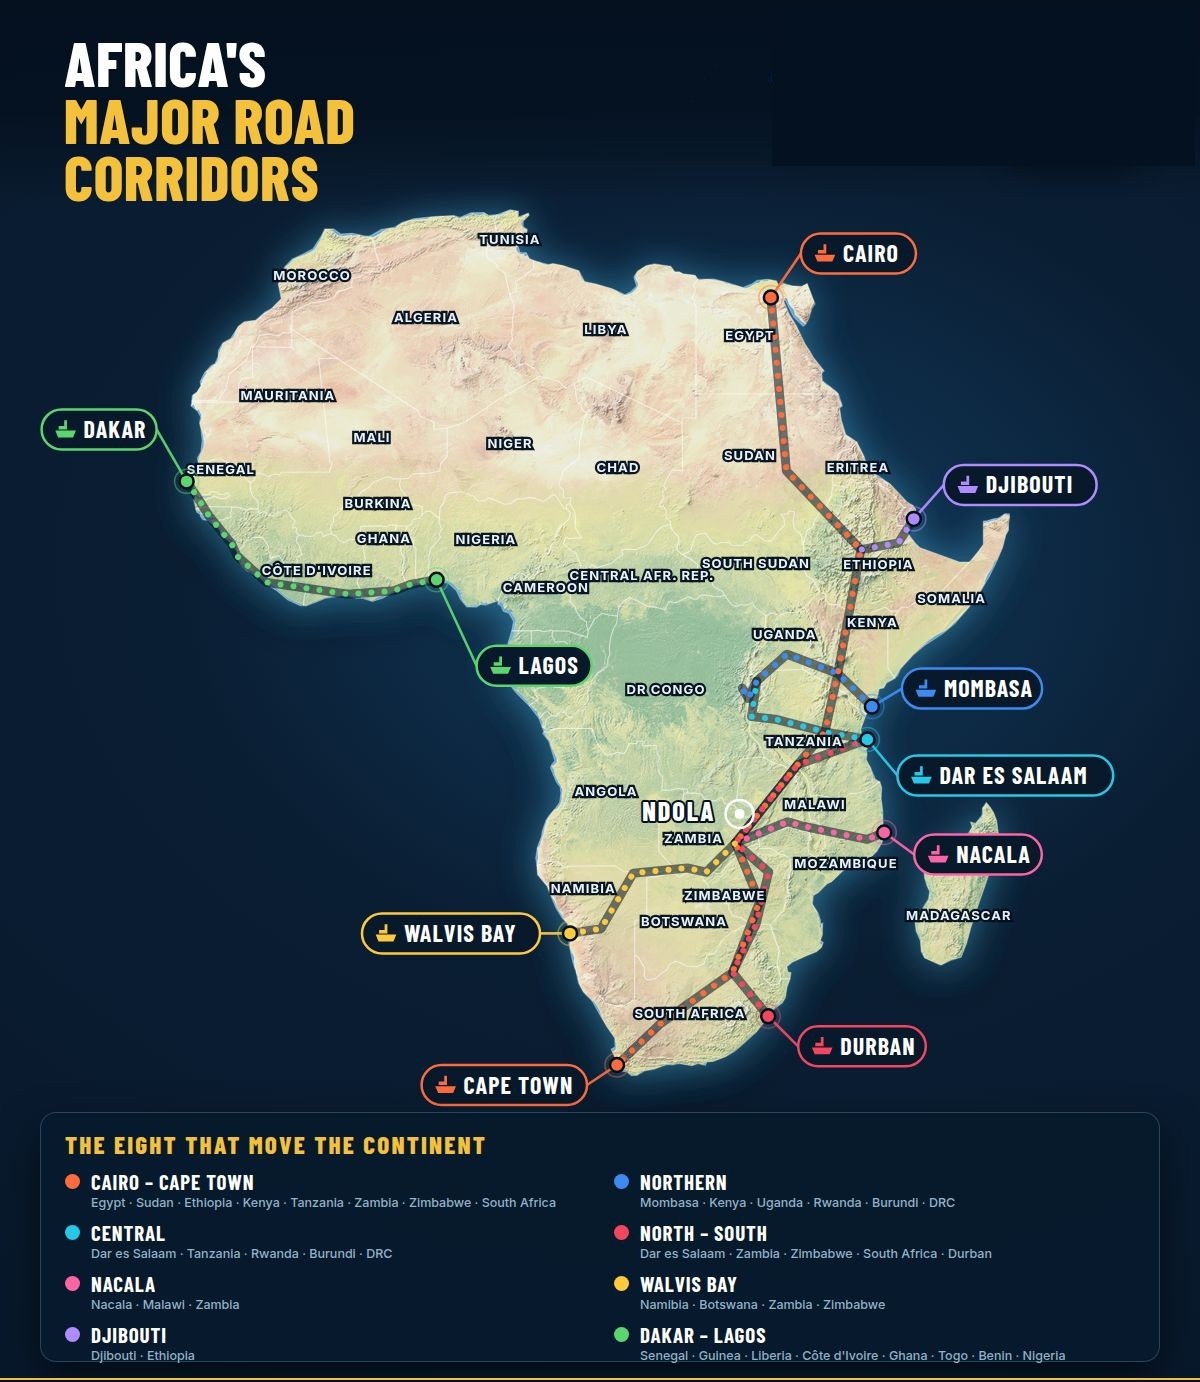
That brings us directly to the eight corridors that move the bulk of the continent’s overland trade. Applying the APEPI lens to each reveals clear differences in risk, reliability, and landed-cost impact.
| Corridor | Geographic Coverage | Risk Level | Primary Bottlenecks | Core Advantage |
|---|---|---|---|---|
| Cairo to Cape Town | North-to-South Spine (Egypt to S. Africa) | High Risk | Political volatility, uneven road quality | Massive continental scale & reach |
| Northern Corridor | Mombasa → Uganda, Rwanda, DRC | Moderate Risk | Mombasa congestion, Malaba delays | Mature OSBP & electronic tracking |
| Central Corridor | Dar es Salaam → Rwanda, Burundi, DRC | Moderate Risk | Port delays at Dar es Salaam, inland roads | Reliable alternative to Mombasa |
| North–South Corridor | Durban / Dar es Salaam → Copperbelt | High Risk | Kasumbalesa & Chirundu crossings | Critical for mining & heavy industrial trade |
| Nacala Corridor | Nacala (Mozambique) → Malawi, Zambia | Moderate Risk | Seasonal weather, multimodal links | Shortest Indian Ocean access for landlocked buyers |
| Walvis Bay Corridor | Namibia → Botswana, Zambia, Zimbabwe | Low Risk | Lower vessel frequency, inland freight cost | High speed, low congestion, minimal risk |
| Djibouti Corridor | Djibouti → Ethiopia | High Concentration | Single-artery bottleneck vulnerability | Direct link for 120M+ consumer market |
| Dakar to Lagos | West African Coastal Spine | High Risk | Multiple borders, urban delays (Lagos) | Direct access to major West African markets |
The Eight Corridors That Shape Landed Cost
Cairo to Cape Town (the North–South Spine)
Egypt–Sudan–Ethiopia–Kenya–Tanzania–Zambia–Zimbabwe–South Africa. This is the long continental backbone. When fully functional it offers the most direct overland path from Mediterranean and Red Sea gateways to Southern African markets. Advantages include potential scale and the ability to serve multiple industrial and consumer clusters. Risks are substantial: political and security volatility in parts of Sudan and Ethiopia, uneven road quality in intermediate sections, and multiple border crossings that multiply clearance exposure. For exporters, this corridor rewards careful route planning and contingency options. Transit-time variability is high; working-capital requirements rise accordingly.
Africa Major Road
Northern Corridor
Mombasa into Uganda, Rwanda, Burundi, and eastern DRC. This remains the primary gateway for much of East and Central Africa. Strengths include relatively mature corridor institutions, growing use of electronic cargo tracking, and established one-stop border posts at key points. Weaknesses appear in periodic congestion at Mombasa, capacity constraints on certain road sections, and residual delays at secondary borders. When Mombasa performs well, landed costs into Kampala or Kigali stay competitive. When it does not, the entire inland chain feels the pressure. Exporters using this route should monitor real-time truck turnaround data and maintain flexibility toward the Central Corridor alternative.
Central Corridor
Dar es Salaam into Rwanda, Burundi, and DRC. This functions as the natural alternative when the Northern Corridor congests. Advantages include shorter distances for certain Central African destinations and progressive improvements in port and road infrastructure. Risks centre on capacity limits at Dar es Salaam during peak periods and the quality of inland links into the DRC. For time-sensitive or high-value cargo, the Central Corridor can deliver better predictability than a congested Northern route. For bulk or low-margin goods, the cost differential must be calculated carefully against total transit time and inventory carrying cost.
North–South Corridor (Dar es Salaam–Zambia–Zimbabwe–South Africa / Durban)
This route feeds the Copperbelt and the industrial south. It is highly sensitive to conditions at Kasumbalesa and other critical border points. When those crossings operate smoothly, the corridor supports efficient movement of minerals, machinery, and consumer goods. When they back up, the effects cascade through Zambian and regional supply chains. Infrastructure quality varies; governance and security risks are elevated in certain segments. Exporters serving mining or manufacturing clients in the region must treat border performance as a primary variable in their landed-cost models rather than a residual afterthought.
Nacala Corridor
Nacala into Malawi and Zambia. This offers the shortest Indian Ocean access for several landlocked markets. Advantages include reduced sea-leg distance and progressive rail and road upgrades. Risks include capacity constraints, seasonal weather impacts, and the need for reliable multimodal coordination. For certain bulk and containerised cargoes destined for Malawi or eastern Zambia, Nacala can produce meaningfully lower total logistics cost than longer routes via Dar es Salaam or Durban. The key is verifying end-to-end reliability rather than relying on port-to-port distance alone.
Walvis Bay Corridor
Namibia into Botswana, Zambia, and Zimbabwe. Often described as quiet and relatively clean, this corridor remains chronically under-utilised relative to its potential. Strengths include lower congestion, solid port infrastructure in Walvis Bay, and improving road links. Weaknesses include limited frequency of sailings, higher relative inland costs for some destinations, and still-developing corridor marketing. For exporters prioritising predictability and lower theft or corruption exposure, Walvis Bay can outperform busier East and Southern African gateways. The trade-off is usually schedule density and total inland freight.
Djibouti Corridor
Djibouti into Ethiopia. More than 90 percent of Ethiopian trade moves along this single artery. It is a classic high-concentration, high-stakes corridor. Advantages include dedicated infrastructure investment and the sheer volume that supports specialised services. Risks are concentration risk itself, periodic congestion, and any disruption that immediately affects a market of over 120 million people. For Ethiopia-bound cargo, corridor choice is effectively binary. Performance on border efficiency, infrastructure quality, and security therefore carries outsized weight in any landed-cost calculation.
Dakar to Lagos (West African Coastal Spine)
Senegal–Guinea–Liberia–Côte d’Ivoire–Ghana–Togo–Benin–Nigeria. This is West Africa’s busiest overland artery and one of its most complex. Advantages include access to large consumer and industrial markets and progressive one-stop border post development in parts of the corridor. Risks include multiple border formalities, variable road conditions, security concerns in certain stretches, and chronic congestion around major urban nodes, especially Lagos. Exporters must model cumulative border time and informal costs carefully. Digital freight tools and strong local partners become essential rather than optional.
What APEPI Reveals Across the Network
When the five APEPI dimensions are applied consistently, a clear pattern emerges. Ports that score well on pure vessel turnaround can still produce poor end-to-end outcomes if the connecting corridor scores poorly on border efficiency or infrastructure quality. Conversely, a moderately performing port paired with strong corridor governance and regional integration can deliver superior landed-cost results.
African Port
This has direct implications for how exporters, importers, and logistics managers should allocate attention and capital:
- Transit time is no longer a simple function of distance or vessel speed. It is the sum of port dwell, corridor speed, and cumulative border friction.
- Inland freight and clearance risk become primary variables in pricing and margin models.
- Working capital is directly affected by corridor reliability. Longer or more variable transit times lock up cash that could otherwise fund the next production cycle.
- Insurance, security, and contingency planning must be corridor-specific rather than generic.
Two exporters can quote identical FOB prices from the same factory and arrive at substantially different landed costs at the customer’s warehouse. The difference is rarely the ocean vessel. It is the corridor chosen—or inherited—after the gateway port.
Quantifying Corridor Friction: How Border Delays Erosion Working Capital
To understand why corridor selection is a primary financial decision rather than a residual logistics detail, consider the mathematical reality of border friction on inventory holding costs and cash-to-cash cycles.
The Working Capital Drag Formula
Daily Capital Loss = (Shipment Value × Annual WACC / 365) + Daily Truck Detention Fee
Scenario A: Kasumbalesa Crossing
2-Day Delay at DRC/Zambia Border
- Cargo: 10 trucks of industrial machinery ($1,500,000 total FOB value)
- Truck Detention Fees: 10 trucks × 2 days × $350 = $7,000
- Capital Drag (18% WACC): ($1.5M × 18% / 365) × 2 days = $1,479
- Total Direct Loss: $8,479
Scenario B: Malaba Border Post
4-Day Congestion on Northern Corridor
- Cargo: 5 containers of FMCG goods ($250,000 total value) into Kigali
- Storage & Demurrage: 5 units × 4 days × $200 = $4,000
- Inventory Carrying Cost (20%): ($250k × 20% / 365) × 4 days = $548
- Total Direct Loss: $4,548
Note: Static spreadsheets fail because corridor variance dictates actual landed margin. Integrating real-time corridor risk metrics into pre-shipment financial modeling prevents unabsorbed out-of-pocket losses.
Practical Implications for B2B Operators
Operational teams should treat corridor selection as a strategic decision, not a residual logistics detail. A disciplined approach includes:
- Mapping every major destination against at least two viable corridors and scoring each on the five APEPI dimensions using current data.
- Building landed-cost models that explicitly include expected border delays, truck turnaround variability, and security premiums rather than using average or historical figures.
- Establishing real-time visibility on critical nodes (Kasumbalesa, Malaba, Chirundu, key West African crossings) so that routing decisions can shift when conditions deteriorate.
- Aligning contractual terms—Incoterms, demurrage/detention language, force-majeure clauses—with the specific risk profile of the chosen corridor.
- Using digital tools for HS classification, duty estimation, and documentation consistency to reduce avoidable clearance friction at borders.

African Trade Corridors
Platforms that aggregate trade intelligence, document generation, and cost modelling can reduce the administrative burden of maintaining this level of corridor awareness. Contextual use of specialised calculators and compliance resources available through Platform.Tendify.Net helps operators keep models current without building everything in-house.
Related operational depth can be found in analyses of cross-border logistics efficiency and the evolving role of digital freight solutions: streamlining cross-border logistics for efficient B2B trade and the role of digital freight forwarders in modern B2B supply chains.
Download the Complete African Trade Logistics Toolkit
Access our operational manuals, dynamic financial calculation worksheets, and risk-mitigation frameworks to optimize your corridor performance.
The African Trade Corridor Clearance & Documentation Manual
Includes master document checklists (ECTN, T1, AfCFTA), critical border post pre-clearance rules (OSBPs), and the top 5 documentation errors causing border seizures.
End-to-End Landed Cost & Corridor Friction Calculation Worksheet
A structured financial model featuring hidden-cost breakdown matrices, fill-in-the-blank WACC drag calculators, and dual-corridor tipping-point evaluation formulas.
Corridor-Specific Incoterms® & Risk Mitigation Playbook
Guidelines for optimizing DAP/FCA terms for land transit, ready-to-use legal Force Majeure clauses, and overland cargo insurance checklists.
The Real Export and Import Formula
The true sequence is not factory → port → vessel.
It is factory → port → vessel → gateway port → corridor → border → customer.
Corridor choice sets transit time, inland freight, clearance risk, working-capital intensity, and final landed cost. Two shipments leaving the same factory on the same vessel can diverge sharply once they hit the hinterland. One arrives competitively; the other arrives late, expensive, or both.
Borders are not merely checkpoints. They function as economic control towers. Infrastructure that fails to reduce friction at those control towers delivers limited competitive value.
The operators who treat corridor performance as a first-order variable—rather than an afterthought after the bill of lading is issued—will systematically outperform those who continue to optimise only the maritime leg. In a continent where intra-African trade remains structurally constrained by logistics cost and reliability, that difference compounds into market share, margin resilience, and the ability to serve customers who demand predictability.
Which corridor are your goods moving on? And did you choose it, or did you inherit it?
Frequently Asked Questions (FAQ)
Key insights on African trade corridors, APEPI metrics, and landed-cost optimization.
1. What is the African Port of Entry Performance Index (APEPI)?
APEPI is an analytical framework that evaluates trade gateways beyond port terminal efficiency. It measures end-to-end corridor performance across five dimensions: Border Efficiency, Infrastructure Quality, Trade Fluidity, Governance & Security, and Regional Integration.
2. Why is port turnaround time alone insufficient for evaluating logistics efficiency in Africa?
A container can clear a modern port terminal in under 48 hours but still face delays of days or weeks due to border bottlenecks, customs processing delays, poor hinterland connectivity, or security risks along the road corridor. True landed-cost competitiveness depends on the entire gateway system.
3. How do border delays directly impact working capital for B2B exporters?
Border delays trigger daily truck detention/demurrage fees and tie up capital in inventory for longer periods. For example, a 48-hour delay on high-value capital goods can inflate inland transport expenses by nearly 15% and extend the cash-to-cash conversion cycle significantly.
4. Which trade corridors are most critical for intra-African trade?
The eight main overland corridors shaping African trade include Cairo to Cape Town, the Northern Corridor (Mombasa), Central Corridor (Dar es Salaam), North–South Corridor (Copperbelt), Nacala Corridor, Walvis Bay Corridor, Djibouti Corridor, and Dakar to Lagos.
5. How can platforms like Tendify help trade operators manage corridor risk?
Tendify aggregates trade intelligence, document generation, duty estimation, and dynamic cost-modeling tools to help operators build accurate landed-cost projections, streamline compliance, and choose optimal corridors before issuing bills of lading.
Optimize Your Corridor Performance & Landed Costs
For teams ready to tighten control over documentation, cost modelling, and cross-border process reliability, structured registration provides immediate access to the operational tools designed to support exactly these strategic decisions.

