


وبلاگ
EV Valuation Paradox: Why Tesla Outvalues BYD by 11x
A single container of lithium-ion cells leaves a Chinese battery plant bound for a European assembly line. Another set of the same cells moves to a North American Gigafactory. Both end up in electric vehicles that roll off production lines within weeks of each other. One company will report higher unit sales at year-end. The other will trade at a valuation more than eleven times larger.
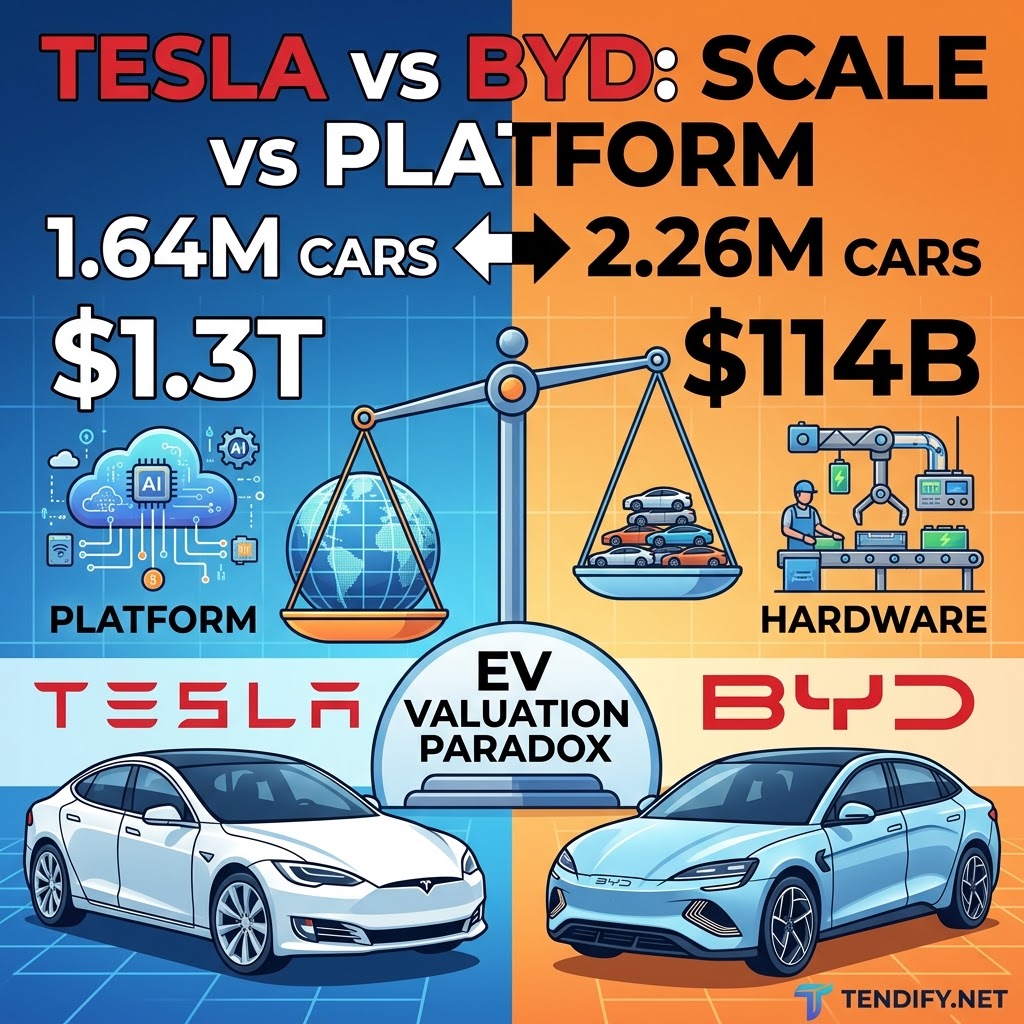
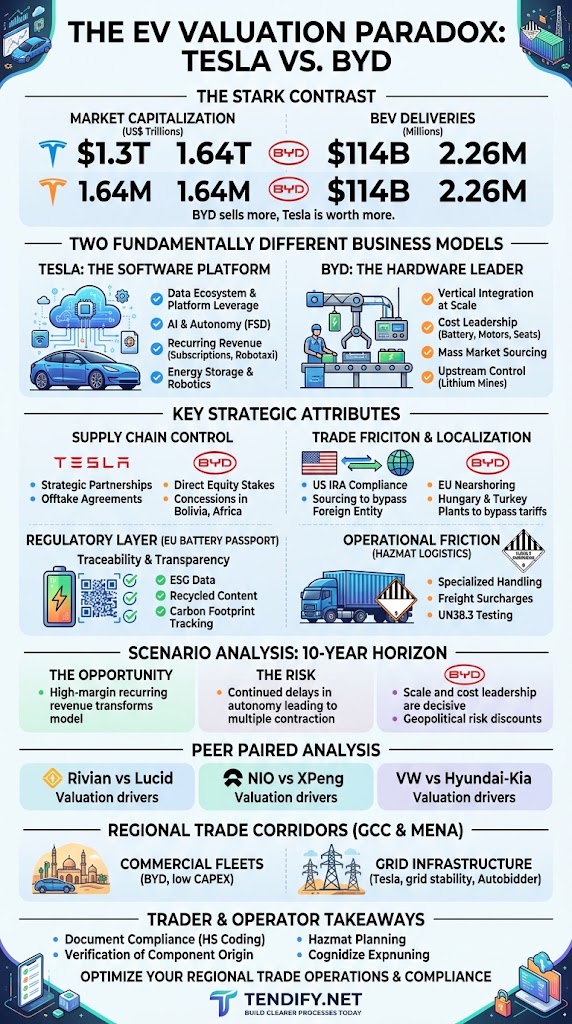
That is the core paradox of the global EV industry in 2026. BYD delivered approximately 2.26 million battery-electric vehicles in 2025. Tesla delivered roughly 1.64 million. Yet Tesla’s market capitalization sits near $1.3–1.47 trillion while BYD’s hovers around $100–114 billion. Price-to-sales ratios tell the same story: Tesla trades near 12.7x while BYD sits near 1.0x.
Markets are not confused. They are pricing two fundamentally different businesses.
Financial & Valuation Metrics Snapshot (2026)
Side-by-side comparison of underlying market fundamentals and platform valuation metrics.
The Hardware Scale Leader Versus the Software Optionality Platform
BYD has mastered vertical integration at industrial scale. It produces its own Blade batteries, motors, semiconductors, and even seats. This control delivers a structural cost advantage estimated by independent analysts at several thousand dollars per vehicle compared with competitors that rely more heavily on external suppliers. Gross margins remain competitive even on lower-priced models, and the company has expanded aggressively into Europe, Latin America, and other export markets.
EV Valuation Paradox
Tesla operates a different model. Vehicle sales still generate the majority of revenue, yet investors assign the bulk of its valuation to future software, autonomy, energy storage, and robotics cash flows. Full Self-Driving subscriptions, potential robotaxi networks, Megapack deployments, and humanoid robot programs carry software-like margins that traditional automotive businesses cannot match. Once a vehicle is sold, incremental software updates and services can generate recurring high-margin revenue without the same capital intensity.
This difference in perceived future cash-flow quality explains the valuation gap more cleanly than any single-quarter delivery number. Traditional automakers typically trade at low single-digit price-to-sales multiples because their economics are capital-heavy, cyclical, and low-margin. Tesla is priced closer to a technology platform that happens to manufacture vehicles. BYD is priced as a highly efficient industrial manufacturer of vehicles and batteries.
Infrastructure Moat
The Supercharger Monopoly: NACS Standardization & High-Margin Utility Yields
How controlling the physical and digital energy grid converts rival EV sales into high-margin recurring cash flows for Tesla.
A critical driver behind Tesla’s premium valuation—and one completely absent from BYD’s corporate model—is the aggressive monetization of its global charging network. By transitioning the North American Charging Standard (NACS / SAE J3400) into the undisputed regional monopoly and opening its European V4 Supercharger network to third-party OEMs, Tesla has successfully transformed a capital expenditure cost center into an infrastructure utility with software-like gross margins.
1. NACS Tollbooth Economy
With major legacy automakers (Ford, GM, Rivian, Volvo, Mercedes-Benz, and Hyundai-Kia) fully adopting NACS, millions of non-Tesla EVs now pay a surcharge per kWh. Every competitor vehicle sold effectively operates as a revenue-generating asset for Tesla’s charging ecosystem.
2. High-Margin Service Layer
Unlike vehicle hardware manufacturing subject to thin cyclical margins, electron resale combined with Tesla’s Autobidder energy trading platform achieves software-esque operating margins (~30%–40%), driven by dynamic surge pricing and grid arbitrage.
3. European Grid Arbitrage
In Europe—where CCS2 standardization forced early interoperability—Tesla’s V4 Supercharger hubs utilize integrated Megapack storage to capture off-peak grid power and retail it during peak tariff hours, creating a high-yield energy trading network across key transit corridors.
| Strategic Dimension | Tesla Supercharger Network | BYD Charging Strategy |
|---|---|---|
| Ecosystem Positioning | Proprietary-turned-standard public utility monopoly | Reliance on 3rd-party public infrastructure & state grids |
| Revenue Model | High-margin recurring kWh resale + subscription plans | Zero direct recurring charging infrastructure revenue |
| Valuation Impact | P/S multiple expansion via infrastructure moat | Valued purely as hardware automotive assembler |
Investor Takeaway: Markets do not view Tesla’s Supercharger footprint merely as a customer convenience amenity; they price it as the default, toll-collecting energy backbone of Western electrification. BYD’s total reliance on external public infrastructure leaves it exposed to third-party network bottlenecks and deprives it of an essential recurring revenue stream.
2026 Tech Frontier
Emerging Battery Warfare: BYD Blade 2.0 vs. Tesla 4680 & Solid-State Strategy
A comparative breakdown of hardware optimization versus manufacturing-driven scaling in next-generation cell architecture.
As the EV market transitions into its next maturity cycle in 2026, the competitive line between hardware cost leadership and technology optionality is drawn sharply along battery chemistry and cell manufacturing strategy. BYD’s deployment of its Blade Battery 2.0 and Tesla’s evolution of the 4680 Dry Battery Electrode (DBE) architecture demonstrate two opposing philosophies for securing margin dominance.
BYD Blade 2.0
LMFP / Fast-Charge
BYD’s second-generation Blade technology shifts from standard LFP toward Lithium Manganese Iron Phosphate (LMFP) chemistry, pushing gravimetric energy density to 190–210 Wh/kg.
- 8C Super-Fast Charging: Enables 10% to 80% charge replenishment in approximately 9–10 minutes via 800V/1000V architecture.
- 1,000 km Range Scale: Achieves high-nickel range performance at a fraction of the bill-of-materials (BOM) cost.
- Safety Profile: Retains full nail-penetration immunity while increasing structural Cell-to-Body (CTB) integration to ~75%.
Tesla 4680 & Solid-State Roadmap
NCM / Process Innovation
Tesla’s strategy centers on mastering the Dry Battery Electrode (DBE) process for both anode and cathode, targeting radical CAPEX reductions rather than pure chemical change alone.
- Full DBE Breakthrough: Eliminates toxic solvents and massive drying ovens, reducing factory footprint and energy usage by over 70%.
- Silicon-Carbon Anodes (NC30/50): High-density variants engineered for specialized applications like Cybercab, Semi, and high-performance trims.
- Solid-State Gateway: DBE mastery serves as the essential manufacturing stepping stone toward scalable solid-state production.
| Technical Parameter | BYD Blade 2.0 (LMFP) | Tesla 4680 (NCM DBE) |
|---|---|---|
| Energy Density (Cell Level) | 190 – 210 Wh/kg | 240 – 260 Wh/kg (Si-C targets >300 Wh/kg) |
| Manufacturing Core Focus | High-yield stacking & chemistry refinement | Dry coating process speed & CAPEX reduction |
| Estimated Cell Cost ($/kWh) | ~$53 – $60 / kWh | ~$68 – $78 / kWh (at full DBE scale) |
| Strategic Advantage | Immediate mass-volume cost supremacy & fast charge | Long-term manufacturing moat & high energy yield |
Strategic Takeaway for Traders: BYD wins the immediate volume war by pushing cheap iron-based chemistries (LMFP) into energy density levels previously reserved for expensive nickel cells. Conversely, Tesla’s battery investments are aimed at transforming cell production into a solvent-free, highly automated process—unlocking structural cost cuts that will directly back its autonomous vehicle (Cybercab) and robotics infrastructure.
Regulatory Convergence
The EU Battery Passport: Where Hardware Meets Data Transparency
Under the EU Battery Regulation, all electric vehicle and industrial batteries over 2 kWh entering the European market must feature a mandatory digital Battery Passport. This requirement enforces full lifecycle traceability—mandating real-time tracking of carbon footprint metrics, ethically sourced raw materials, and recycled mineral contents via a unified digital ledger.
● ESG Mandates & Carbon Footprint
Automakers can no longer rely solely on low-cost production. Each cell must carry verified ESG data detailing energy consumption during manufacturing, ethical supply-chain audits, and compliance with strict hazardous chemical thresholds.
● Digital Twin & Circular Economy
The battery passport acts as a permanent digital record, capturing State of Health (SoH) and charge cycle history. This data layer is essential for second-life energy storage applications, warranty verification, and end-of-life recycling efficiency.
Strategic Architecture: Vertical Integration Versus Data Ecosystem
The two companies pursue distinct competitive logics.
BYD’s strength rests on control of the physical supply chain. By producing core components internally, it reduces supplier mark-ups, shortens lead times, and protects margins during price wars. This model performs especially well in high-volume, cost-sensitive segments and in markets where tariff or localization requirements favor integrated manufacturers. Export growth has accelerated as the company leverages its cost base to undercut competitors on price while maintaining acceptable profitability.
Upstream Supply Chain
Upstream Mineral Control: Ownership vs. Offtake Agreements
BYD’s cost dominance goes beyond cell manufacturing and the Blade Battery architecture—it reaches deep into upstream mineral extraction. While most automakers buy processed battery chemistry on open markets, controlling critical raw materials at the source creates an irreplaceable structural hedge against global commodity price volatility.
● BYD’s Direct Resource Ownership
BYD secures equity stakes and long-term operating rights in lithium mining concessions across South America (Bolivia, Chile), Africa, and domestic Chinese reserves. Direct access to raw lithium carbonate isolates BYD from market squeezes and supplier markups.
● Tesla’s Market Procurement Model
Tesla relies primarily on long-term supply and off-take contracts with external refiners (such as Albemarle and Ganfeng) while building its own lithium refinery in Texas. This model offers operational agility but exposes margins to index-linked mineral pricing shifts.
Trade Barriers & Nearshoring
Navigating Tariff Walls: Tariff-Hedging via Regional Manufacturing Hubs
The direct export strategy for Chinese-built EVs is facing severe trade friction. With the U.S. enforcing 100% tariffs on Chinese electric vehicles and the EU applying anti-subsidy duties of up to 45%, cross-border hardware trade requires aggressive supply-chain restructuring to bypass prohibitive customs barriers.
● European Localization (Hungary & Turkey)
To maintain tariff-free entry into the European single market, BYD is constructing full-scale passenger vehicle plants in Hungary and Turkey. Localizing assembly inside EU boundaries converts tariff-exposed imports into duty-free European domestic production.
● Americas Corridor (Mexico & Brazil)
Similarly, establishing production hubs in Mexico and Brazil serves a dual purpose: hedging against North American policy shifts while securing duty-free trade advantages across Latin American economic blocs (such as Mercosur).
Tesla’s architecture prioritizes data accumulation, algorithm improvement, and platform leverage. Every vehicle on the road contributes training data. Over-the-air software updates improve capability after the sale. Energy products and potential autonomy services create adjacent revenue streams that scale with limited incremental hardware cost. The risk is execution: autonomy timelines have repeatedly slipped, and regulatory approval for unsupervised robotaxi operations remains incomplete in most jurisdictions.
Both approaches create real advantages. Vertical integration delivers measurable cost leadership today. Ecosystem optionality delivers the possibility of structurally higher margins tomorrow. Markets assign dramatically different probabilities and multiples to those two outcomes.
Strategic B2B Layer
Navigating Rules of Origin & Localization Requirements
Beyond hardware efficiency and software valuation, cross-border EV and battery trade is increasingly shaped by regulatory compliance and raw material origin. Policies such as the U.S. Inflation Reduction Act (IRA) و EU’s Critical Raw Materials Act impose strict thresholds on where critical minerals (lithium, cobalt, nickel, graphite) are extracted, processed, and assembled.
● Tesla’s Supply Chain Adaptation
To qualify for Western consumer subsidies and avoid tariff penalties, Tesla actively restructures its supply chains—shifting battery cell manufacturing to North America and sourcing processed minerals from FTA-partner nations to bypass strict foreign entity restrictions.
● BYD’s Localization Strategy
Facing steep import tariffs in Europe and North America, BYD is transitioning from a pure export model toward regional localization—building new manufacturing hubs in Hungary, Turkey, and Brazil to satisfy local value-addition rules and secure long-term market entry.
What the Numbers Actually Show
Full-year 2025 figures establish the sales hierarchy clearly. BYD’s pure battery-electric volume exceeded Tesla’s by more than 600,000 units. When plug-in hybrids are included, BYD’s total new-energy vehicle deliveries approached 4.5–4.6 million units. Tesla reported its second consecutive annual decline in deliveries.
Profitability metrics are closer than the valuation gap suggests. Both companies generate multi-billion-dollar net income, and gross margins in the automotive segment have converged in certain periods. The divergence appears in how capital markets capitalize those earnings. Tesla’s elevated multiple assumes successful conversion of its installed base into higher-margin software and services revenue. BYD’s multiple reflects the historical norms of capital-intensive manufacturing businesses, amplified by geopolitical risk discounts applied to many Chinese-listed industrial companies.
Currency, listing venue, and investor base also play roles. Tesla trades primarily on U.S. exchanges with deep liquidity and a global growth-oriented shareholder base. BYD faces a different investor composition and the persistent “China discount” that applies across many sectors.
The “China Discount”: Geopolitical Risk, Capital Controls, and Listing Venues
Deconstructing the structural market friction and capital-flow penalties dragging down BYD’s valuation multiple.
Beyond technology roadmaps and operational efficiency, the massive valuation gap between Tesla (~12.7x P/S) and BYD (~1.0x P/S) is deeply tied to capital market mechanics. Global institutional investors apply a structural “China Discount” (Geopolitical Risk Premium) to BYD’s earnings, regardless of its underlying operational strength or market share growth.
Geopolitical Friction & Sanctions
Western institutional capital factors in continuous tail-risk penalties regarding cross-strait tensions, secondary sanctions, and foreign entity restrictions (FEOC under U.S. policies). Western pension funds and sovereign entities limit portfolio exposure to Chinese mainland assets to avoid regulatory forced-divestment scenarios.
Capital Controls & FX Risk
Strict capital mobility oversight by Chinese monetary authorities creates conversion and dividend repatriation friction for offshore shareholders. Additionally, exposure to Renminbi (RMB) currency fluctuations against a dominant US Dollar adds currency hedging costs for global asset managers.
HKEX / Shenzhen Market Liquidity
BYD trades on the Hong Kong Stock Exchange (1211.HK) and Shenzhen Stock Exchange (002594.SZ). These venues lack the hyper-concentrated retail and momentum-driven institutional liquidity profile of the U.S. NASDAQ/NYSE, where Tesla trades as a core component of mega-cap tech indices (S&P 500, QQQ).
| Market Factor | Tesla (US Capital Markets) | BYD (Hong Kong / Shenzhen) |
|---|---|---|
| Primary Listing Exchange | NASDAQ (Deepest global liquidity pool) | HKEX (1211) / SZSE (002594) |
| Investor Base Composition | Global mega-cap growth funds & US retail | Regional Asian capital & selective emerging market funds |
| Geopolitical Risk Factor | Low / Hegemonic currency & legal protection | High / Tariff walls, FEOC rules & trade friction |
| Valuation Multiple Effect | Multiple Premium (Sovereign Safe-Haven) | Multiple Compression (“China Discount”) |
Key Market Insight: Even if BYD continues to outperform Tesla in unit deliveries, revenue growth, and gross manufacturing margins, its stock price multiple will remain compressed as long as international capital markets apply a discount to Chinese equity assets. Tesla’s listing on U.S. markets allows it to harvest a sovereign capital premium that BYD cannot unlock under current geopolitical structures.
Market Intelligence
Competitive Archetypes: Paired Peer Analysis
The divergence between Tesla and BYD mirrors broader structural pairs across the EV landscape. Capital markets evaluate these competitors based on their relative position on the spectrum between pure hardware manufacturing and high-margin software/service platforms:
Implications for Cross-Border B2B Supply Chains
The valuation divergence carries practical lessons for companies operating in international automotive and battery trade.
First, cost leadership through vertical integration remains a powerful competitive weapon in physical goods. Exporters of components, modules, and finished vehicles that control more of their bill of materials can sustain aggressive pricing while protecting margins. This dynamic is visible in GCC and broader MENA markets where buyers of construction equipment, commercial fleets, and industrial energy storage increasingly evaluate total cost of ownership rather than sticker price alone.
GCC & MENA Trade Corridor
Regional Procurement Realities: Mass Fleet Scale vs. Grid-Scale Energy Ecosystems
In the GCC and broader MENA markets—driven by Saudi Arabia’s Vision 2030 and UAE’s Net Zero 2050 initiatives—commercial buyers and state-backed entities actively weigh the tradeoffs between BYD’s hardware cost discipline and Tesla’s integrated energy software platform.
● Commercial Fleets & TCO (BYD)
For commercial fleet operators, ride-hailing groups, and public transport authorities across Dubai, Riyadh, and Doha, BYD’s volume pricing and Blade Battery durability win on Total Cost of Ownership (TCO). Unmatched acquisition costs allow rapid fleet electrification with predictable maintenance overhead.
● Grid Infrastructure & Megapack (Tesla)
Conversely, utility-scale solar projects and gigaprojects demand grid-scale stability. Tesla’s Megapack deployments, integrated with Autobidder energy trading software, provide regional grid operators with automated energy arbitrage and peak-shaving capabilities that go far beyond basic storage hardware.
Second, software and data layers are becoming the highest-margin elements of mobility value chains. Logistics providers, fleet operators, and energy project developers that capture proprietary operational data and convert it into predictive maintenance, routing optimization, or energy arbitrage services create stickier, higher-margin businesses than pure hardware suppliers.
Third, geopolitical and regulatory friction affects valuation as much as operational performance. Companies with diversified manufacturing footprints and multiple market access routes reduce the risk premium that capital markets apply. Single-country concentration, even with superior cost structures, carries measurable valuation consequences.
For B2B traders and supply-chain managers, the practical takeaway is clear: hardware scale wins volume and short-term cost battles; integrated software and data platforms win long-term valuation and customer lock-in. The most resilient operators combine both.
Hazmat Operations
The Hidden Operational Friction: Class 9 Hazardous Logistics
While headline numbers focus on unit deliveries and factory capacity, moving EV battery packs across international borders introduces severe operational complexity. Lithium-ion batteries are legally classified as Class 9 Dangerous Goods (Hazmat) under UN 3480 and UN 3481 regulations. This classification converts standard freight operations into highly restricted, capital-intensive logistics workflows.
● UN 38.3 & Packaging Compliance
Every cell design and battery module must undergo mandatory UN 38.3 thermal, altitude, and shock testing prior to commercial transport. Non-compliant packaging or incorrect State of Charge (SoC) levels above 30% can lead to port impoundments and severe regulatory fines.
● Vessel Allocation & Freight Surcharges
Ocean carriers strictly cap the volume of Class 9 containers permitted per vessel. Combined with elevated marine insurance premiums and specialized thermal monitoring requirements, hazardous freight surcharges can add substantial landed-cost overhead per battery pack.
Scenario Analysis Over a Ten-Year Horizon
Two plausible paths dominate the debate.
In the first, Tesla successfully commercializes unsupervised autonomy and scales robotaxi and Optimus businesses. High-margin recurring revenue transforms the company’s financial profile. Vehicle hardware becomes a distribution channel for software and services. Under this outcome the current valuation can be justified or even expanded.
In the second, autonomy timelines continue to slip, regulatory barriers persist, and price competition intensifies. Tesla is then valued more like a conventional high-volume EV manufacturer. The multiple contracts sharply toward industry norms. BYD’s cost advantage and scale become decisive, and its valuation rises as markets reassess the durability of its industrial model.
Neither outcome is certain. What is observable today is that Tesla’s valuation embeds a high probability of successful platform transition, while BYD’s valuation embeds a low probability of software re-rating and a higher geopolitical risk premium.
Operational Lessons for International Traders and Platform Operators
Experiences across regional supply chains show that pure volume leadership does not automatically translate into superior enterprise value. Companies that treat logistics, compliance, and customer data as strategic assets rather than cost centers consistently attract higher multiples and more resilient capital.
Digital tools that reduce friction in cross-border documentation, duty calculation, and partner discovery lower the effective cost of operating complex international networks. Platforms that integrate real-time market intelligence with transactional capability create the same kind of data flywheel that investors reward in technology businesses. One practical illustration is the set of trade utilities and market calculators available through Platform.Tendify.Net, which help operators convert operational complexity into measurable efficiency gains without requiring proprietary software development.
The same principle applies to contract structures, payment security, and inventory positioning. Operators who document processes rigorously, hedge currency and demurrage risk systematically, and maintain diversified logistics options reduce the operational volatility that capital markets penalize.
Choosing the Strategic Bet
If the priority is operational certainty and cost control in physical goods markets, the vertically integrated model demonstrated by BYD offers clearer near-term advantages. Margin resilience under price pressure and the ability to scale volume rapidly remain powerful in emerging and cost-sensitive markets.
If the priority is capturing the highest-margin layers of the mobility and energy value chain, the platform and data approach carries greater upside—and greater execution risk. Success depends on converting installed hardware into recurring software and services revenue at scale.
Most sophisticated operators will not choose exclusively. They will combine vertical cost discipline in manufacturing and logistics with deliberate investment in data capture, software interfaces, and ecosystem partnerships. The companies that execute both will be positioned to benefit regardless of which pure strategy ultimately dominates capital-market narratives.
The eleven-fold valuation gap is not an accounting error. It is the market’s current assessment of two different futures. One is grounded in the economics of producing physical products at unmatched efficiency. The other is grounded in the economics of turning physical products into platforms for higher-margin digital services. Both futures are already visible in the flow of containers, the structure of contracts, and the design of supply chains that move components and finished vehicles across borders every day.
For businesses navigating those flows, the practical response is to build systems that reduce friction, capture operational data, and preserve optionality. Whether the next decade rewards pure scale or pure platform leverage, the operators who treat logistics, compliance, and information as strategic assets will be better positioned than those who treat them as afterthoughts.
GCC & Global B2B Trade Corridors
Optimize Your Regional Trade Operations & Compliance
As competitive dynamics in the EV, battery, and mobility industries accelerate, operational precision becomes your primary margin defender. Access structured trade utilities, verified partner networks, and duty forecasting tools engineered for cross-border operators.
Building clearer processes today compounds into measurable advantage tomorrow.
Access Tendify Trade Utilities →

