


Blog
Excel for Government Contracts: Turning Data into Tender Profits
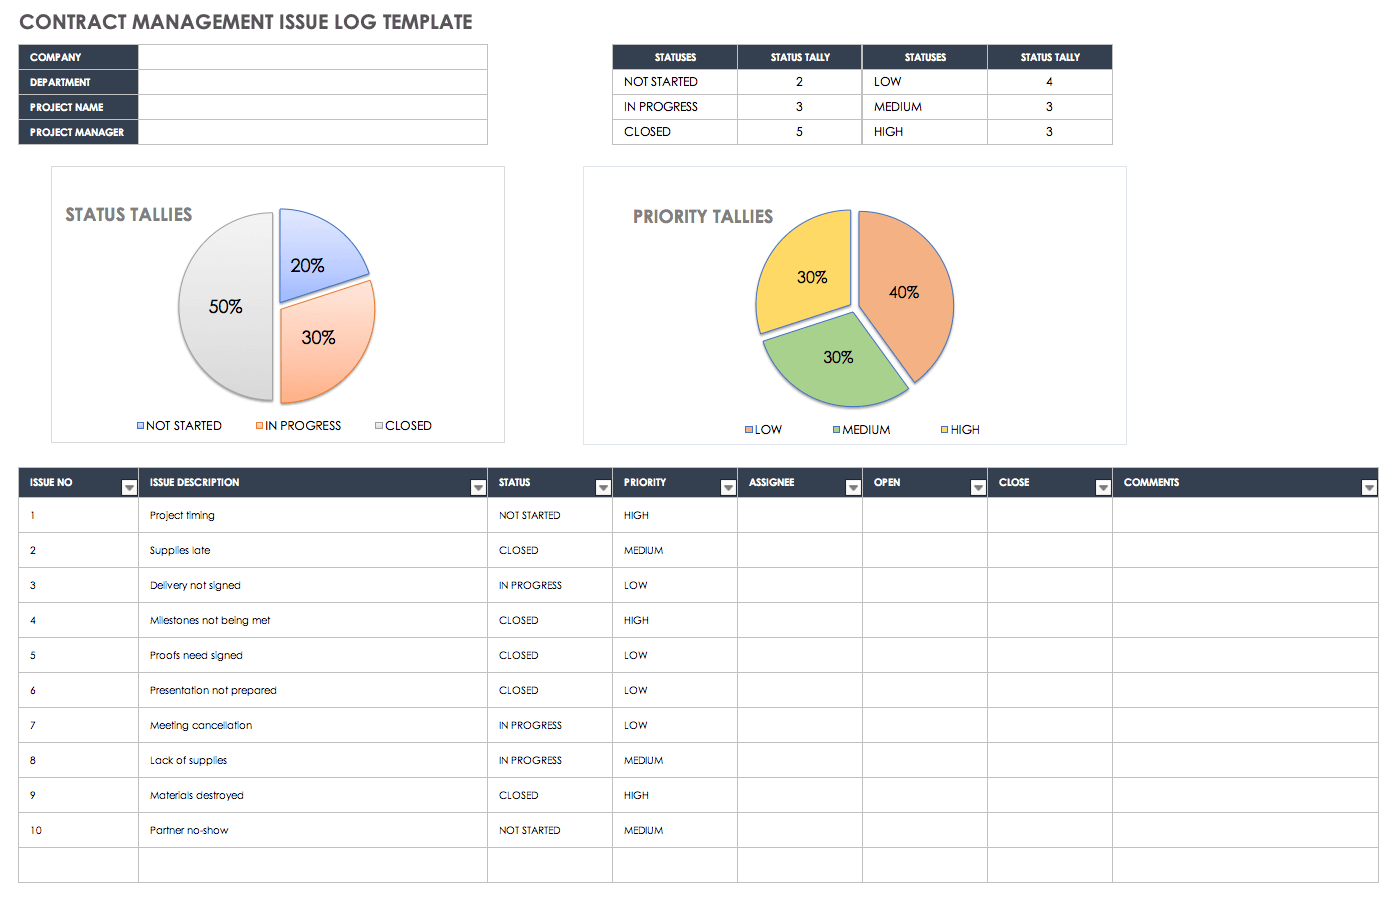
In the high-stakes world of government contracts, especially in infrastructure, construction, and large-scale procurement across emerging markets, a single miscalculation can cost you the deal—or worse, eat into your margins once you’re locked in. Over years of navigating these complex bids and executions, I’ve seen one truth stand out: the traders and contractors who treat Excel as a strategic weapon consistently outperform those relying on intuition or fragmented tools.
This isn’t about basic spreadsheets. It’s about turning Excel into your command center for winning tenders, defending claims, optimizing cash flow, and walking away with stronger profits. Whether you’re bidding on reconstruction projects, supply contracts, or infrastructure works, mastering these techniques gives you precision, credibility, and leverage in negotiations.
In this comprehensive guide, you’ll discover exactly how to deploy Excel across every phase—from pre-tender analysis to post-award execution—along with real-world templates, formulas, best practices, and the “why” behind each tactic. By the end, you’ll have a repeatable system that turns data into decisive advantage.
Why Excel Remains Indispensable for Government Contract Success in 2026
Government tenders, particularly in sectors like construction, energy, and logistics, demand razor-sharp financial modeling, compliance tracking, and risk assessment. Regulations are strict, margins are often thin (frequently 5-15% in competitive bids), and audits are unforgiving.
Excel excels here because it offers unmatched flexibility for custom modeling without needing expensive enterprise software upfront. You can build dynamic models that respond to variables like material price fluctuations, currency shifts, or delay scenarios—critical when negotiating with public entities bound by fixed procedures.
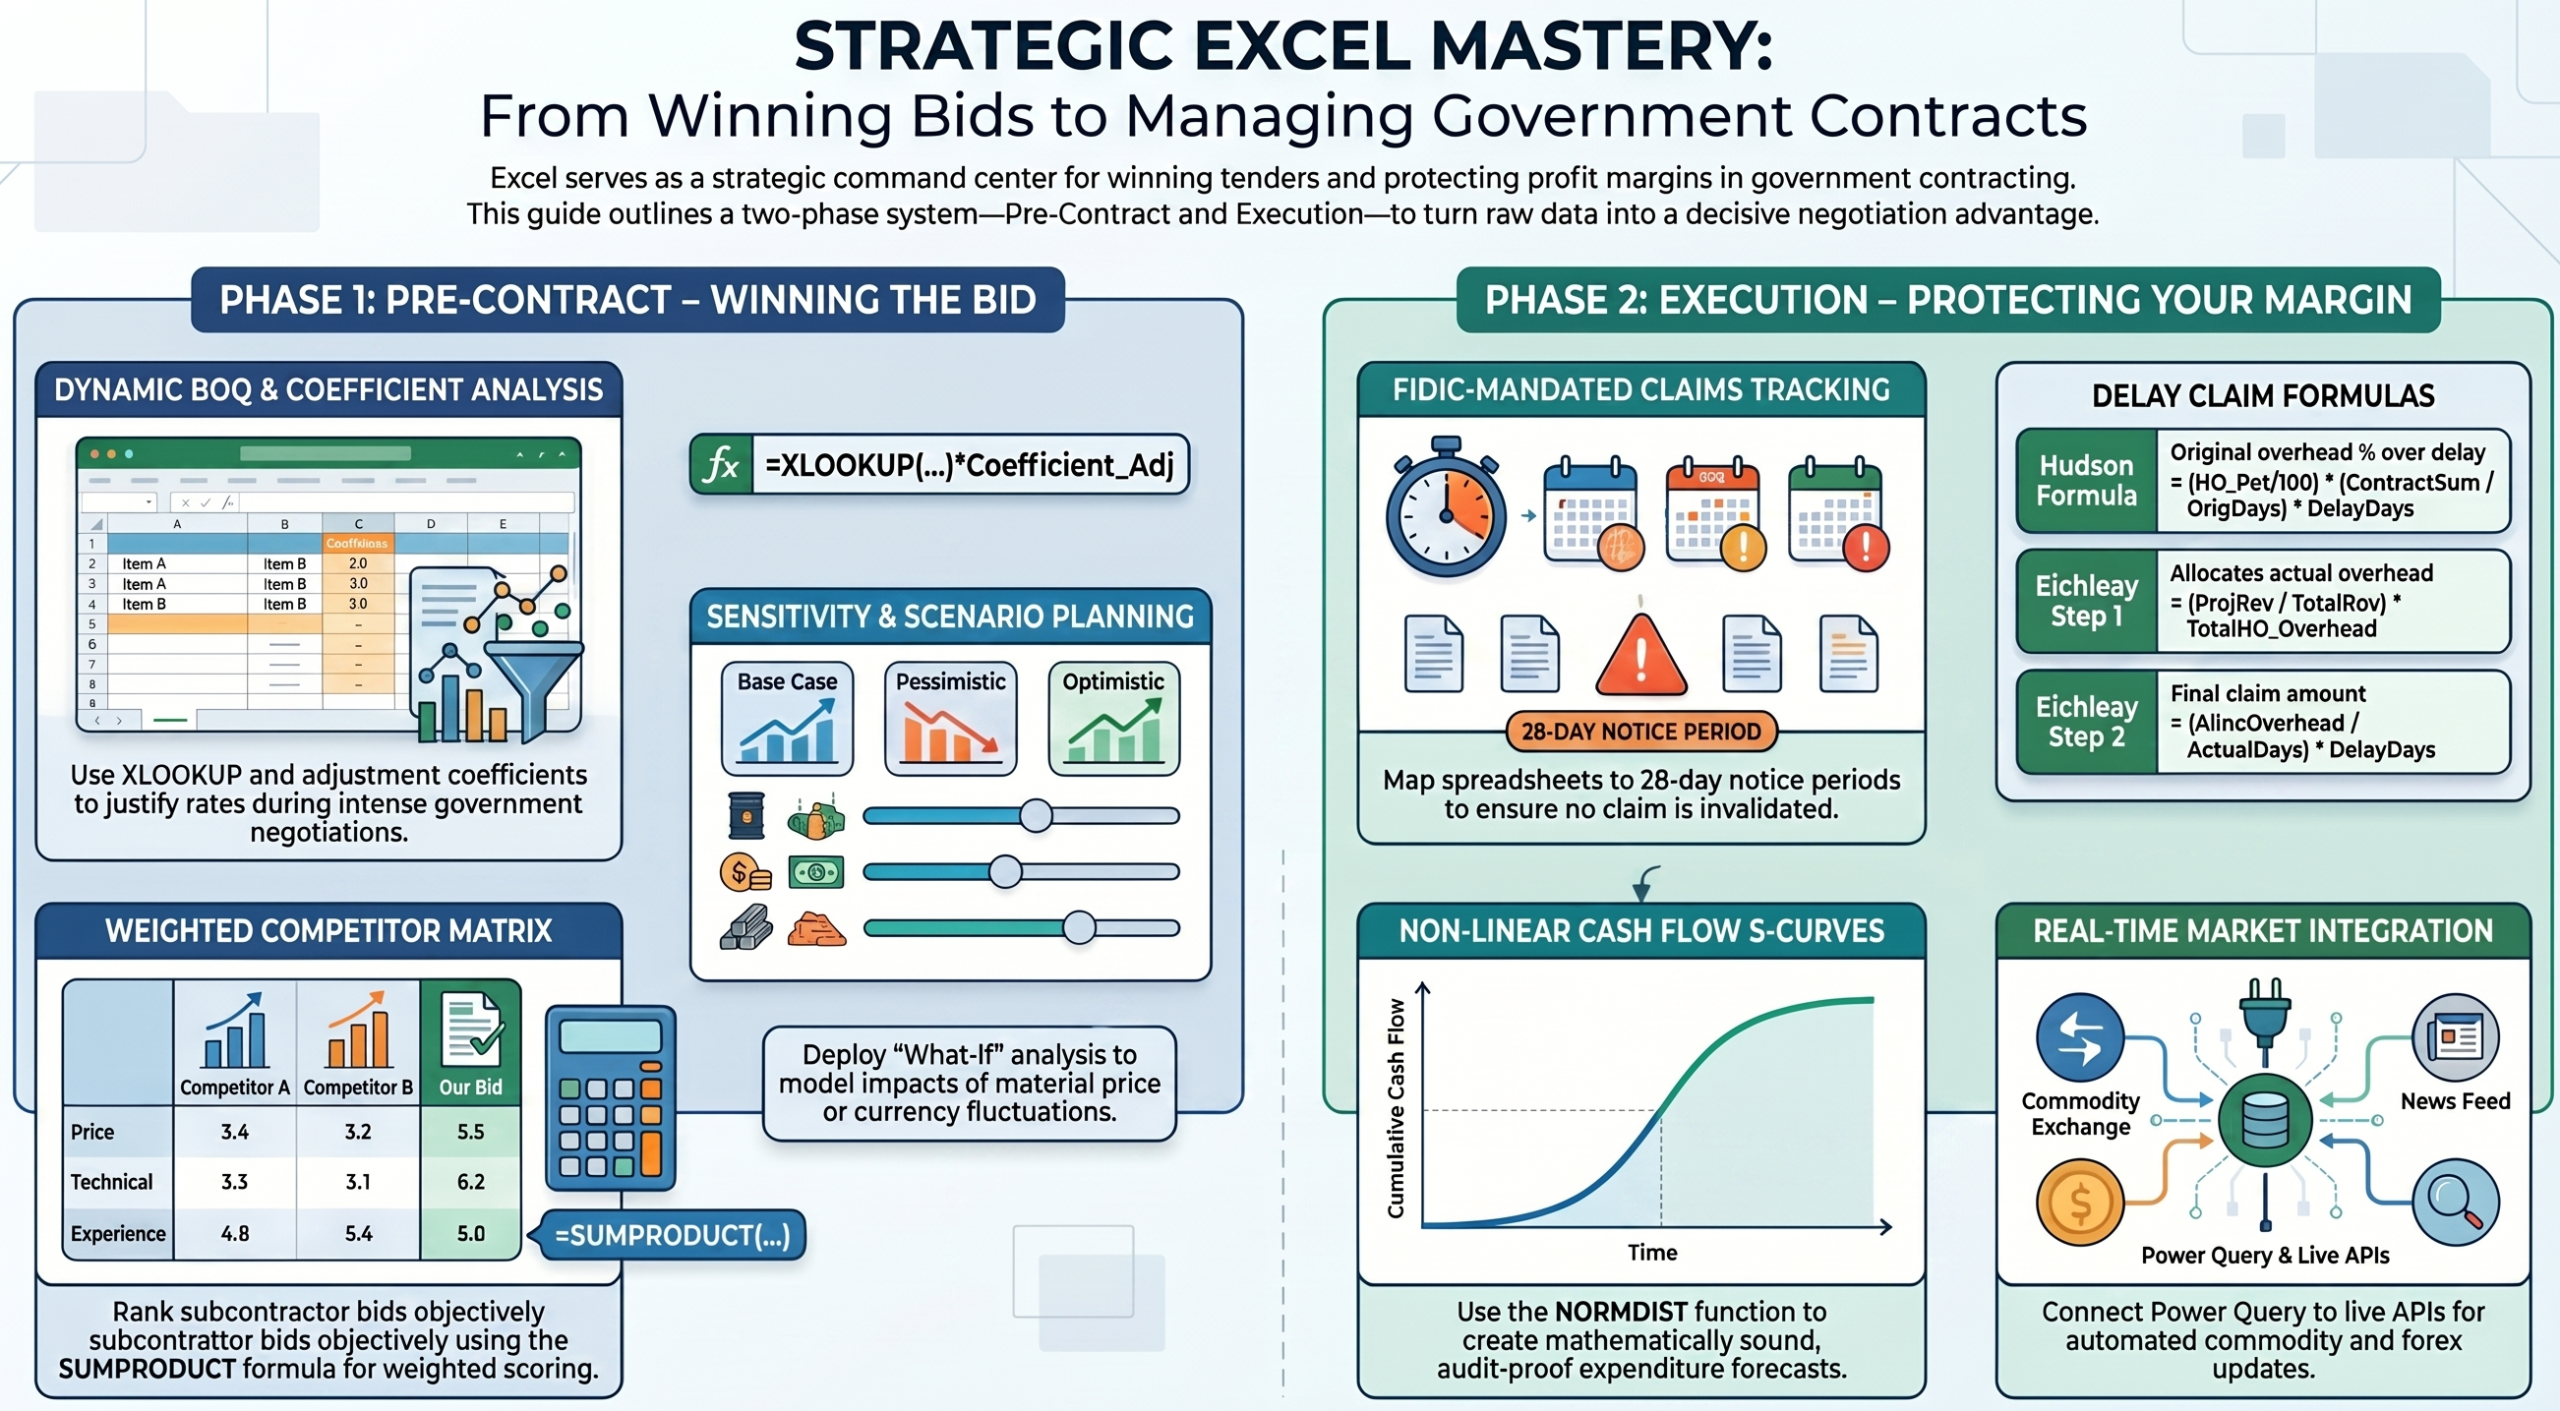
Strategic Spreadsheet Bid Management Guide
Key advantages in practice:
- Precision in cost buildup: Apply coefficients, overheads, and regional adjustments instantly.
- Scenario planning: Test “what-if” outcomes to strengthen your negotiating position.
- Audit-ready documentation: Track every assumption with formulas and comments for transparency.
- Integration potential: Link to your other tools for end-to-end visibility.
However, raw Excel has limits—version control issues, error-prone manual entry, and scalability challenges for massive projects. The pros mitigate this with structured templates, data validation, and macros.
Regional Context
Aligning Excel with FIDIC Frameworks in the GCC & MENA Regions
In emerging markets across the GCC (UAE, Saudi Arabia, Oman) and the wider MENA region (including Iraq), infrastructure, procurement, and construction contracts rarely operate in a vacuum. Instead, they are heavily governed by FIDIC (International Federation of Consulting Engineers) standards—most notably the Red, Yellow, and Silver books. When navigating these high-value public tenders, your Excel models must speak the language of FIDIC to maintain absolute credibility with government employers.
For cross-border traders and contractors, this means transforming your spreadsheets from generic cost trackers into compliance-driven engines. By mapping your Excel sheets to track specific FIDIC-mandated timelines—such as the strict 28-day notice period for contractor claims under Clause 20.1—you ensure that no claim is invalidated due to administrative oversight. Excel becomes the definitive bridge between engineering data and contract law, validating variation orders and extension of time (EOT) requests under regional civil codes.
Phase 1: Pre-Contract – Winning the Tender with Bulletproof Financial Models
Success starts long before submission. Your price proposal must be competitive yet profitable, backed by defensible calculations.

Excel for Government Contracts
Analyzing Bill of Quantities (BOQ) and Applying Adjustments
Start by importing the BOQ into Excel. Create columns for:
- Item description and unit
- Base rate
- Adjustment coefficients (e.g., overhead, profit, regional factors)
- Adjusted rate = Base Rate × (1 + Sum of Coefficients)
Use VLOOKUP or XLOOKUP for dynamic lookups across multiple sheets. For sensitivity, add input cells for variable rates (e.g., steel price) and use Data Tables (What-If Analysis) to model impacts.
Actionable template structure:
- Sheet 1: Raw BOQ import.
- Sheet 2: Coefficient dashboard with named ranges (e.g., OverheadRate, ProfitMargin).
- Sheet 3: Summary with conditional formatting to flag low-margin items (red if <8%).
This setup lets you quickly justify adjustments during negotiations—e.g., “A 12% material escalation changes our margin by only 1.8%, as modeled here.”
Bid Comparison and Competitor Intelligence
When evaluating your position against potential rivals or multiple subcontractors, build a side-by-side comparison matrix. Include columns for total bid, unit prices on key items, delivery timelines, and risk premiums.
Use PivotTables to aggregate subcontractor quotes. Add a “Weighted Score” column with formulas like =SUMPRODUCT(weights, normalized_scores) to rank options objectively.
Risk and Sensitivity Analysis
Government projects are vulnerable to delays, currency volatility, and supply disruptions. Build a Monte Carlo simulation lite using Excel’s built-in tools or simple RAND() functions across 1,000 iterations for key variables. Or use Goal Seek and Solver for optimization.
For example, model cash flow under three scenarios: optimistic, base, and pessimistic. This data becomes powerful in negotiations: “Our model shows that extending mobilization by 30 days requires X adjustment to maintain viability.”
Pro tip: Protect sheets with passwords and use Data Validation lists for inputs to prevent errors in shared files during team reviews.
Phase 2: Contract Execution – Turning Excel into Your Operational Backbone
Once awarded, the real work begins. Excel helps maintain control over finances, timelines, and claims.
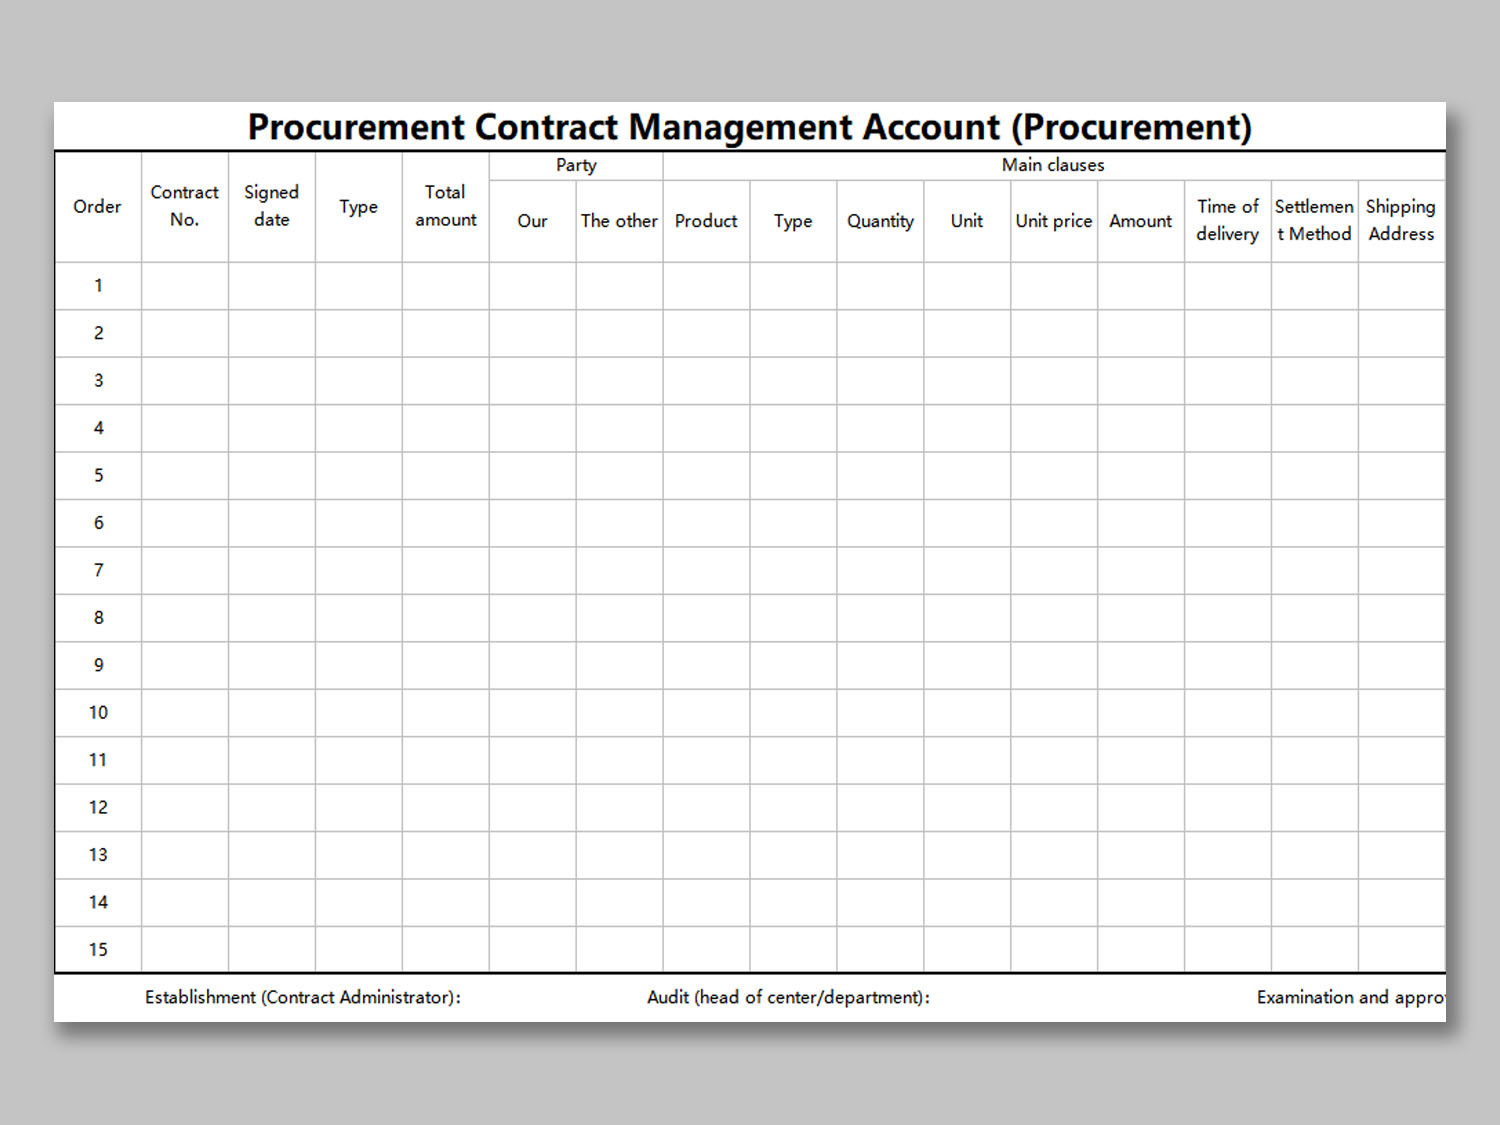
Turning Excel into Your Operational Backbone
Monthly Progress Billings and Variation Orders
Create a master “Progress Claim” workbook:
- Track quantities executed vs. planned.
- Calculate certified amounts, retentions, and deductions (insurance, taxes, etc.).
- Use SUMIFS for category breakdowns.
Link to a master schedule sheet. For price adjustments (escalation), reference official indices in a lookup table and automate calculations with formulas like =BaseAmount * (CurrentIndex/BaseIndex).
Claims Management: Building an Ironclad Case
Delays and variations are common. Document everything quantitatively:
- Separate sheets for each potential claim: delay events, cost impacts, critical path analysis.
- Columns: Event Date, Description, Responsible Party, Duration Impact (days), Cost Impact (formula-linked).
- Use Timeline charts or simple Gantt visuals via conditional formatting and bar charts.
Engineering Standard
Quantifying EOT Claims: Hudson vs. Eichleay Formulas in Excel
When a government project is delayed due to employer-responsible events, securing an Extension of Time (EOT) is only half the battle. You must also recover unabsorbed head office overheads. In international and public arbitrations, relying on arbitrary estimates will sink your claim. Instead, professional contractors embed standardized legal-engineering formulas directly into their Excel recovery models.
| Method | Mathematical Logic | Excel Formula Implementation |
|---|---|---|
| Hudson Formula (Widely used in MENA/FIDIC) | Uses the original contract overhead percentage to calculate delay period losses. (HO % ÷ 100) × (Contract Sum ÷ Period) × Delay Days | =(HO_Pct/100) * (ContractSum / OriginalDays) * DelayDays |
| Eichleay Formula (US Standard / High Burden) | Allocates actual overhead incurred during the contract period based on project-to-company revenue ratio. | Step 1: Alloc. Overhead=(ProjRevenue / TotalRevenue) * TotalHO_OverheadStep 2: Claim Amount =(AllocOverhead / ActualDays) * DelayDays |
Pro Tip for Auditors: While the Hudson formula is easier to isolate in Excel using named ranges, government clients often challenge it because it relies on the tendered overhead percentage rather than actual costs. If your accounting system tracks real-time corporate overheads via ERP, deploying the Eichleay model in your spreadsheets will present a far more legally robust and audit-proof defense during intense contract negotiations.
PivotTables summarize impacts by category. In negotiations, present a one-page dashboard: “This delay added 45 days and $Y in overheads, supported by contemporaneous records.”
Advanced Tech
Real-Time Commodity & Forex Integration via Power Query
In volatile emerging markets, relying on static pricing for volatile commodities like bitumen, cement, rebar, or structural steel is a recipe for margin erosion. Instead of manually updating your procurement models, you can transform Excel into a live market feed by connecting Power Query directly to external REST APIs. This automates currency conversions (e.g., USD to AED, SAR, or IQD) and commodity index updates every time you open or refresh your workbook.
- Fetch the Endpoint: Go to
Data > From Webin Excel. - Input the API URL: Enter your provider’s endpoint, including your API token and base currency parameter (e.g.,
https://api.provider.com/v1/latest?base=USD). - Parse the JSON: Power Query will automatically open. Click
Into Tableon the JSON record to extract live rates. - Link to BOQ: Close & Load the data into a dedicated reference sheet, then use
XLOOKUPto dynamically update your unit rate analysis.
Negotiation Leverage: When defending a price escalation claim before a government committee, displaying a query that pulls historical and live data directly from independent, third-party benchmarks instantly removes subjectivity from the negotiation table.
Cash Flow Forecasting and Budget Control
Cash flow is king—negative flows kill projects. Build a 12-36 month forecast:
- Columns: Period, Planned Inflows (progress payments), Outflows (labor, materials, subs), Cumulative Position.
- Incorporate S-curve progress profiles for realistic distribution.
Use FORMULATEXT for documentation and Sparklines for quick visual trends. Link actuals from accounting exports via Power Query for live updates.
Advanced: Create a dashboard sheet with slicers for project filters, key KPIs (e.g., % complete vs. % billed), and alerts (conditional formatting for negative cumulative cash).
Integrating the Cumulative S-Curve with Cash Flow Forecasts
Government entities across the GCC (Saudi Arabia, UAE, Oman) rarely accept linear or flat cash flow distributions. Because actual mobilization, execution peak, and demobilization naturally form an S-Curve, your Excel forecast must reflect this non-linear reality to remain credible during audits and payment negotiations.
Instead of manually guessing monthly distributions, you can automate a mathematically sound S-Curve directly inside Excel using a cumulative normal distribution model via the NORMDIST function. This distributes your total contract value based on a standard bell curve of resource deployment.
=NORMDIST(Current_Month, Mean_Month, Standard_Deviation, TRUE)
Step-by-Step Implementation Matrix
| Parameter / Column | Excel Variable Setup | Strategic Purpose |
|---|---|---|
| 1. Timeline Index | Month 1, 2, 3... N | Acts as the independent X-variable for the distribution function. |
| 2. Mean (Peak Activity) | Total Months ÷ 2 | Calculates the exact central inflection point where project spending peaks. |
| 3. Standard Deviation | Total Months ÷ 6 | Ensures 99.7% of all distributed values comfortably fit within the project duration. |
| 4. Cumulative Value (%) | =NORMDIST(A2, Mean, SD, TRUE) | Generates the smooth, continuous cumulative percentage from 0% to 100%. |
| 5. Monthly Weight (%) | =Current_Cum% - Previous_Cum% | Isolates the targeted, incremental cost or revenue allocation for that specific month. |
NORMDIST generated S-curve dashboard to a government consulting engineer demonstrates corporate maturity. It instantly eliminates subjective disputes over monthly cash requirements, aligning your financial projection directly with institutional engineering data models.Advanced Excel Techniques for Professional Edge in Negotiations
To stand out in meetings:
Dashboards and Visuals: Use PivotCharts, slicers, and Power BI integration (free desktop version links seamlessly) for executive summaries. One-pagers win attention—summarize variances, forecasts, and risks on a single view.
Automation with VBA: Record macros for repetitive tasks like generating PDF reports or formatting claims. Simple scripts can validate data or pull from external sources.
VBA Automation
One-Click PDF Export & Email Automation for Submissions
Instead of manually saving your progress claim or variation summary as a PDF, opening Outlook, attaching the file, and writing an email to the government consultant every month, you can automate the entire pipeline. Below is a production-ready VBA script. It dynamically exports your active sheet as a secured PDF and drafts an official submission email.
Sub ExportClaimToPDFAndEmail()
    ' Define variables
    Dim ws As Worksheet
    Dim pdfPath As String
    Dim OutApp As Object
    Dim OutMail As Object

    Set ws = ActiveSheet
    ' Dynamically save file to user's desktop with timestamp
    pdfPath = CreateObject("WScript.Shell").SpecialFolders("Desktop") & _
              "\" & ws.Name & "_Submission_" & Format(Now, "YYYY-MM-DD") & ".pdf"

    ' 1. Export the Active Progress Claim sheet to PDF
    ws.ExportAsFixedFormat Type:=xlTypePDF, Filename:=pdfPath, _
        Quality:=xlQualityStandard, IncludeDocProperties:=True, _
        IgnorePrintAreas:=False, OpenAfterPublish:=False

    ' 2. Initialize Outlook Instance
    Set OutApp = CreateObject("Outlook.Application")
    Set OutMail = OutApp.CreateItem(0)

    ' 3. Draft the Official Email
    On Error Resume Next
    With OutMail
        .To = "engineer@governmentagency.gov"
        .CC = "pmomailbox@company.com"
        .Subject = "Official Progress Claim Submission: " & ws.Name
        .Body = "Dear Engineering Committee," & vbCrLf & vbCrLf & _
                "Please find attached the formalized, data-validated monthly progress claim for your audit and approval." & vbCrLf & _
                "Generated automatically via Tendify Excel Core Systems." & vbCrLf & vbCrLf & _
                "Best Regards," & vbCrLf & _
                Application.UserName
        .Attachments.Add pdfPath
        .Display ' Opens the email window for final review before sending
    End With
    On Error GoTo 0

    ' Clean up memory
    Set OutMail = Nothing
    Set OutApp = Nothing
End Sub
How to use this: Press ALT + F11 in Excel, insert a new Module, and paste the code. You can then assign this Macro to a shape or button labeled “Generate & Send Official Submission” on your main dashboard sheet. This level of institutional operational workflow ensures deadlines are never missed due to bureaucratic lag.
Data Validation and Security: Lock formula cells, create dropdowns for standardized entries, and use Protect Sheet to maintain integrity during collaborative reviews.
Integration with Other Tools: Export to PDF for official submissions or link models to your CRM/ERP for holistic visibility.
Common Pitfalls and How to Avoid Them
- Version chaos: Use OneDrive/SharePoint with version history or strict naming conventions (e.g., ProjectName_Claims_v2026-06-15.xlsx).
- Formula errors: Always cross-check with manual spot calculations on key figures. Use Trace Precedents.
- Over-complexity: Start simple and layer complexity. Test models thoroughly before live use.
- Compliance gaps: Ensure your formats align with local requirements (e.g., specific tax deduction structures).
Regular audits of your Excel files—treat them like contract appendices.
Scaling Beyond Basic Excel: When and How to Level Up
For larger portfolios, combine Excel with Power Query for data consolidation across projects and Power Pivot for advanced analytics. This creates a near-enterprise setup without full software costs.
Many successful operators maintain a “Master File” template library: BOQ analyzer, cash flow forecaster, claims logger—all interconnected.
Real-World Impact: From Bid to Profitable Delivery
Traders using these methods report faster claim approvals, better cash management (reducing financing needs by 15-25%), and higher win rates through demonstrated professionalism. In competitive environments, the ability to present data-driven arguments builds trust faster than promises.
Tying It Together with Modern Trade Platforms
While Excel handles the heavy analytical lifting, pairing it with specialized platforms streamlines the ecosystem. Tools for contract generation, cost calculators, and compliance checklists complement your models perfectly. Head over to Platform.Tendify.Net to explore integrated resources—like duty calculators, HS code finders, and document builders—that feed directly into your Excel workflows. It’s a practical way to connect data modeling with real-time market opportunities and verified partners, saving time on the operational side while you focus on strategic negotiations.
Check related insights on our blog for deeper dives, such as strategies for government tenders, logistics optimization, or specific market access guides: Cheapest Way to Export to Saudi Arabia in 2026, Iraq Contracts: Don’t Sign Without These Clauses, and Mastering FASAH for Saudi Customs.
Your Next Steps: Build Your Excel System Today
- Download or build core templates (BOQ analyzer, cash flow model, claims tracker).
- Standardize your file structure across all projects.
- Practice scenario modeling on a past or upcoming bid.
- Review one live file weekly for accuracy and insights.
- Integrate with your broader toolkit for efficiency.
The difference between average and exceptional contract performance often comes down to the rigor of your numbers. Excel gives you the foundation—discipline and insight turn it into profit.
Ready to strengthen your operations? Join thousands of B2B traders optimizing their global deals on Tendify. Sign up at Tendify.net today, list your capabilities, connect with verified opportunities, and put these strategies into action with the right partners and tools at your fingertips. Your next winning contract starts with better data—start building it now.

