


المدونة
Ocean Freight Volatility: 5 Steps to Cut Shipping Costs Fast

A mid-sized machinery exporter in the Gulf recently watched a single 40-foot container’s all-in cost to the US East Coast jump nearly $400 in one week. The booking that looked solid on Monday required an urgent re-quote by Friday. That pattern is no longer exceptional. It has become the operating environment for cross-border B2B traders moving goods on the major east-west lanes.
Drewry’s latest assessments show Shanghai–Los Angeles rates at approximately $7,185 per 40-foot container (up 5% week-on-week) and Shanghai–New York at $9,587 (up 3%). These are not isolated spikes. They sit on top of already elevated baselines, ongoing Asian port congestion, deliberate capacity management by carriers, and fresh cost pressures from the Panama Canal and bunker fuel. For companies whose landed costs determine contract viability and margin survival, the question is no longer whether rates will move—it is how to build operational resilience against the movement.
This guide breaks down the current drivers, quantifies the commercial impact, and lays out concrete steps that procurement, logistics, and finance teams can implement immediately. The focus remains practical: protecting cash flow, reducing exposure to blank sailings, and turning freight volatility into a manageable variable rather than a recurring surprise.
Market Snapshot: Ocean Freight & Reliability Key Indicators
A high-level summary of current rate benchmarks, schedule reliability metrics, and emerging cost surcharges across major East-West lanes.
The Current State of Transpacific and Global Ocean Freight
West Coast and East Coast rates remain firm. The most recent verifiable Drewry data places the Shanghai–Los Angeles leg near $7,185 per FEU and the Shanghai–New York leg near $9,587. Both lanes posted sequential gains of 5% and 3% respectively in the latest reported week. These levels sit well above the softer ranges seen in parts of 2025 and reflect a combination of residual front-loading, tighter effective capacity, and carrier discipline.
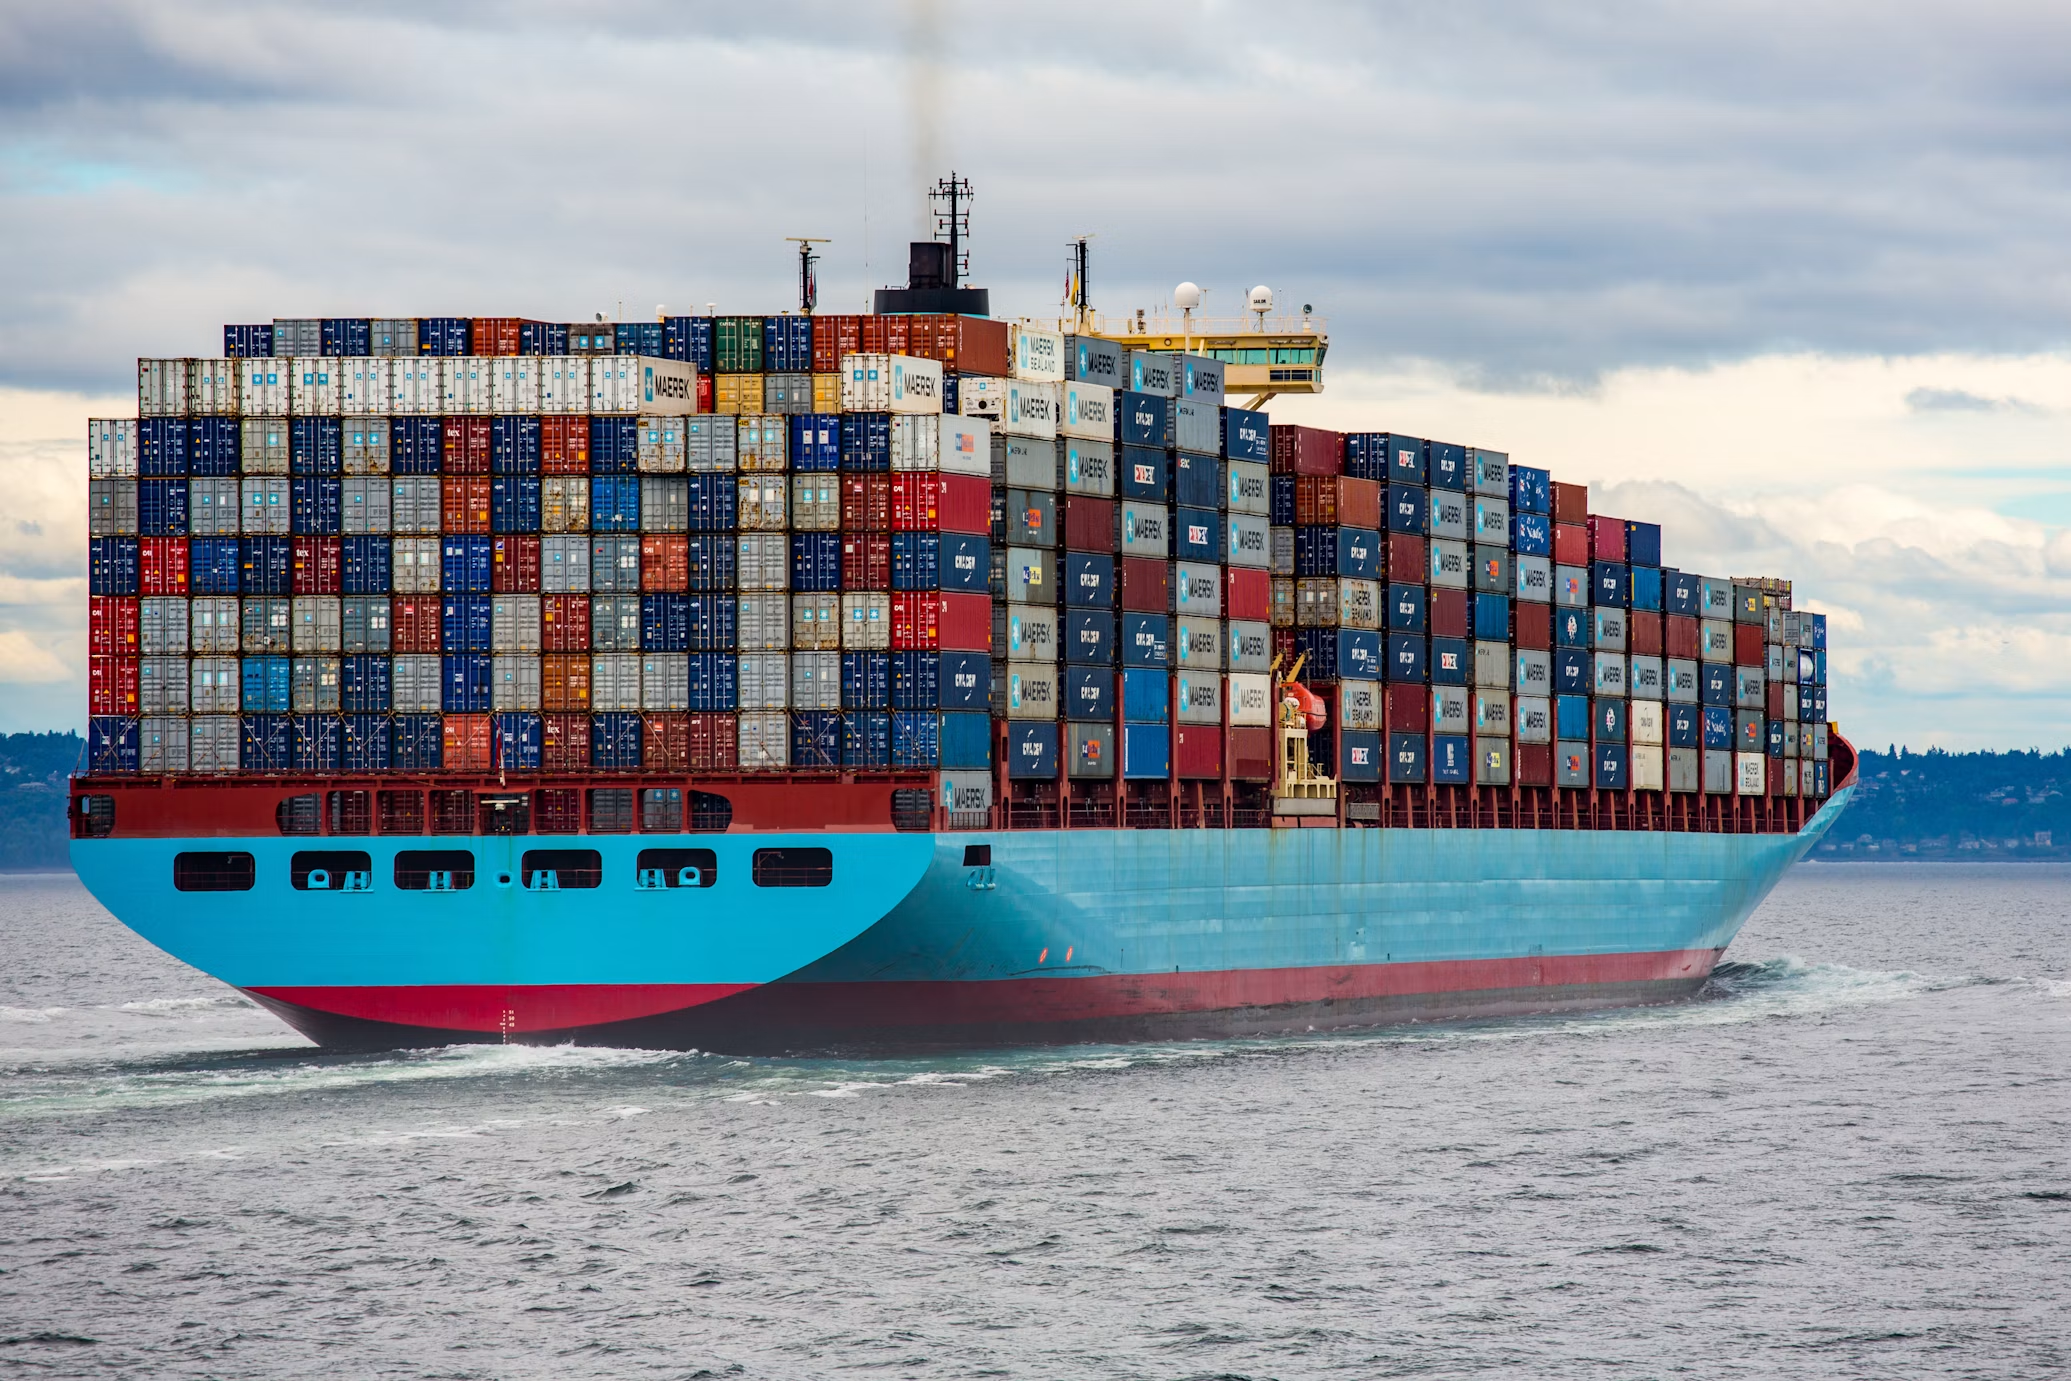
Ocean Freight Volatility
Port congestion across key Asian gateways continues to erode usable capacity. Shanghai and Ningbo, among others, have experienced persistent vessel queues and weather-related disruptions. Global liner schedule reliability fell to 56.4% in July 2026, according to Sea-Intelligence data, with the average delay for late arrivals reaching 6.06 days. That reliability figure represents one of the weaker readings of the year and directly translates into longer lead times, higher inventory buffers, and elevated demurrage and detention exposure for shippers.
Carriers have responded with active capacity management. Multiple blank sailings—six in one recent weekly window—have been announced to keep supply aligned with demand. The effect is a tighter market even when underlying cargo volumes are not uniformly strong. Blank sailings remove sailings that shippers had planned around, forcing last-minute shifts to more expensive alternatives or delayed production schedules.
East Coast and Gulf of Mexico routes face additional pressure from Panama Canal constraints. Reduced transit slots and draft limitations have prompted carriers to introduce or raise surcharges on services that rely on the canal. At the same time, low-sulfur fuel oil prices in Singapore have climbed sharply relative to earlier conflict-related baselines—market observations point to increases in the region of 70% or more in some periods—raising the likelihood of higher bunker adjustment factors.
Taken together, these factors create a cost environment in which a single delayed vessel or an unexpected GRI can erase the profit margin on a high-volume shipment.
Why These Rate Movements Hit B2B Traders Harder Than Most
In pure commodity or high-volume consumer goods trades, freight is often a smaller percentage of total cost and can sometimes be passed through. In B2B industrial, machinery, construction materials, and specialized equipment trades, the picture is different. Contract prices are frequently fixed months in advance. Customers expect delivery windows measured in weeks, not open-ended ranges. Working capital is already stretched across production, inspection, and payment terms.
When ocean freight moves 5–12% in a short window, several cascading effects appear:
- Landed cost calculations that underpinned the original quote become inaccurate.
- Cash-flow timing shifts as inventory sits longer in transit or at destination terminals.
- Demurrage and detention charges accumulate when vessels arrive late and free time is consumed.
- Relationship capital is spent explaining delays that originated far upstream of the supplier’s control.
Operational assessments across multiple Gulf and broader Middle East supply chains show that companies without structured freight contingency plans routinely absorb 3–8% margin erosion on affected lanes before they even begin corrective action. The ones that treat ocean freight as a strategic variable rather than a pure cost center recover faster.
💱
The Unseen Multiplier: Foreign Exchange (FX) Volatility in Ocean Freight
Ocean freight invoices, surcharges, and terminal handling fees are overwhelmingly denominated and settled in US Dollars (USD). For international traders operating in markets with local or pegged currency considerations, compounding freight rate increases with FX exposure creates a dual-risk environment:
- Double Margin Erosion: A 5% increase in base ocean freight combined with a local currency depreciation against the USD turns a manageable logistics hike into a severe margin drag on fixed-price customer quotes.
- Cafeteria Currency Adjustment Factors (CAF): Shipping lines frequently pass on currency risks in secondary corridors using CAFs when regional currencies fluctuate, adding unbudgeted line items to final destination terminal bills.
- Working Capital Strain: Payment windows for freight forwarders are tightening. Settling unexpected USD-based freight surcharges on short notice diverts local liquidity meant for core supplier commitments.
🌐
The Cascade Effect: Why Transpacific Volatility Directly Impacts GCC & Regional Trade
While headline rates focus on East-West megacorridors (Shanghai to US West/East Coasts), Middle Eastern B2B traders do not operate in isolation. Global container fleets and vessel allocations are highly interconnected; disruptions on major transpacific routes ripple directly into Gulf supply chains through three operational mechanisms:
Quantifying the Exposure: A Practical Cost Framework
Visual Breakdown: Landed Cost Structure for a 40ft Container (Shanghai → US East Coast)
Estimated total cost distribution per FEU (~$11,100 total potential outlay including delay risks)
Consider a typical 40-foot container of industrial components moving from an Asian manufacturing hub to a US East Coast distribution point. Using the latest published range:
- Base ocean freight: ~$9,500–9,700
- Bunker and emergency surcharges: variable, frequently $300–800 additional
- Origin and destination terminal handling: $400–700 combined
- Potential demurrage/detention from a 6-day average delay: $150–300 per day after free time
A five-percentage-point rate increase on the base freight alone adds roughly $475–485 per container. For a company moving 40–60 containers per month on this lane, the monthly impact exceeds $20,000 before secondary costs. Multiply that across several lanes and the annual exposure becomes material enough to affect financing conversations and customer pricing negotiations.
Similar arithmetic applies to Gulf-origin or Gulf-destination trades that interlink with transpacific or Asia-Europe services. Congestion in Shanghai or Ningbo still cascades into feeder schedules and hub connections that serve the GCC.
Step-by-Step Actions to Stabilize Freight Costs in the Current Market
1. Shift from pure spot buying to a hybrid contracting approach
Pure spot exposure maximizes flexibility but maximizes volatility. The more resilient model combines:
- Core volume under short-to-medium term contracts or service contracts with defined rate corridors.
- A residual percentage kept on spot for opportunistic capacity or urgent shipments.
- Explicit language on how GRIs, bunker adjustments, and blank-sailing alternatives will be handled.
Teams that renegotiate or re-bid even a portion of their annual volume every 60–90 days reduce the lag between market moves and their own cost base.
2. Build buffer into both lead time and free time
With average delays running above six days on late vessels, planning systems calibrated to pre-2024 reliability levels systematically understate transit time. Practical adjustments include:
- Adding 7–10 days of buffer to critical path calculations for US East Coast and Gulf destinations.
- Negotiating additional free time at destination terminals where possible, or pre-arranging preferential storage rates.
- Monitoring vessel ETA updates more aggressively in the final 10 days before arrival so inland transport can be rescheduled before free time expires.
3. Diversify routing and carrier exposure
Over-reliance on a single service string or alliance amplifies blank-sailing risk. Parallel options worth evaluating:
- Alternative West Coast gateways with rail connections eastward when canal or East Coast congestion intensifies.
- Selective use of non-alliance or niche carriers on secondary strings that maintain higher schedule adherence on specific corridors.
- Pre-qualified air or multimodal options for high-value, time-sensitive components so the entire order does not wait for the delayed ocean leg.
4. Tighten documentation and HS classification discipline
Delays at origin or destination ports are frequently compounded by incomplete or inconsistent paperwork. Correct HS codes, accurate commercial invoices, and complete certificates of origin reduce the probability that a delayed vessel is further delayed by customs queries. Tools that standardize classification and generate consistent export documentation reduce one controllable source of friction.
5. Integrate freight visibility into commercial decision-making
Rate movements should feed back into quoting systems within days, not weeks. Finance and sales teams need near-real-time awareness of the current all-in cost on key lanes so that new customer quotes reflect market reality. Companies that still rely on quarterly average freight assumptions routinely underprice during rising markets and overprice during softening ones.
Secondary Cost Drivers That Multiply the Pain
Demurrage and detention remain two of the most underestimated line items. When vessels arrive late and free time is short, daily charges quickly accumulate. In GCC ports the same dynamic appears on inbound containers waiting for inland clearance or on export boxes staged for delayed vessels. Systematic tracking of free-time utilization and early intervention with terminals can recover thousands of dollars per container.
Bunker costs continue to transmit into freight rates. Elevated low-sulfur fuel prices in Singapore and other bunkering hubs give carriers a clear rationale for higher BAF. Monitoring the underlying fuel indices allows more accurate forecasting of the next surcharge round and better timing of contract renewals.
Panama Canal restrictions add a structural overlay for East Coast and Gulf services. Draft limitations and reduced daily slots mean some carriers will continue to apply canal-related surcharges or divert vessels, lengthening transit times. Shippers with flexibility to accept West Coast discharge plus inland movement sometimes find a lower total landed cost despite the extra domestic leg.
Building an Internal Freight Risk Protocol
High-performing trading organizations formalize a simple protocol:
- Weekly review of key lane rates against the previous four-week average.
- Pre-defined trigger points (e.g., 8% cumulative increase) that automatically escalate discussion to commercial and finance leadership.
- Pre-approved contingency carriers and routings for each major lane.
- Clear ownership of demurrage and detention recovery actions.
- Quarterly stress-testing of the most important customer contracts under higher freight scenarios.
This protocol does not eliminate volatility. It converts it from a series of fire drills into a managed process.
Where Digital Tools Fit Without Over-Promising
Visibility platforms and rate intelligence tools reduce the information lag between the market and the decision-maker. Real-time schedule reliability data, blank-sailing trackers, and multi-carrier rate comparison engines allow logistics teams to act on the same information carriers and large forwarders already use. Some platform environments also aggregate duty, documentation, and logistics calculators so that the full landed-cost picture can be refreshed quickly when ocean rates move. One such environment is available at Platform.Tendify.Net for teams that prefer a single operational view rather than multiple disconnected portals.
The value is speed of decision, not the elimination of cost.
Looking Ahead: Structural Factors That Will Persist
Several forces are unlikely to reverse quickly. Carrier capacity discipline has proven effective at supporting rates even when demand softens. Asian port infrastructure continues to face volume pressure and weather variability. Climate-related constraints on the Panama Canal are now a recurring seasonal factor rather than a one-off event. Fuel price volatility remains tied to broader energy and geopolitical conditions.
For B2B exporters and importers, the practical implication is clear: treat ocean freight as a strategic risk category that requires the same level of process rigor applied to currency exposure or supplier concentration. Companies that continue to treat it as a pure transactional cost will keep discovering margin leakage after the fact.
Related operational guidance on managing container charges appears in the discussion of demurrage versus detention practices in GCC ports. Additional context on multimodal options and cost structures can be found in analyses of Gulf logistics corridors and end-to-end trade cost modeling.
Red Sea Security: How the Makkah Pact Impacts B2B Landed Costs & Logistics
Download Checklist & Commercial Templates (PDF)
Get the complete 3-in-1 compliance guide featuring step-by-step export checklists, Incoterms® 2020 commercial invoice templates, and global HS code tariff lookup tables.
Closing the Gap Between Market Reality and Commercial Execution
The current combination of elevated transpacific rates, reduced schedule reliability, blank sailings, canal constraints, and bunker pressure is not temporary noise. It is the operating backdrop for the remainder of 2026. The organizations that will protect and expand margins are those that convert this information into disciplined booking practices, realistic lead-time buffers, diversified routing, and faster feedback loops between logistics and commercial teams.
Freight will continue to move. The difference between those who absorb the movement and those who manage it lies in the systems and decision cadence they put in place today.
Ready to Lock In Control Over Your Landed Costs?
From real-time rate monitoring and HS code documentation accuracy to secure cross-border payment flows and partner verification—protect your trade margins before the next rate hike hits.
Create Free Account on Tendify →

