


Blog
Inventory Optimization in Global Trade: The 2026 Playbook

In the high-stakes world of international trade, I’ve learned one truth the hard way after years of moving containers across volatile markets: the real money isn’t made in the deal itself—it’s in how well you manage what sits between signing the contract and delivering the goods. Too little inventory, and you watch opportunities slip to competitors while damaging hard-won relationships. Too much, and your working capital turns into expensive warehouse ballast, eating margins with every passing day.

Inventory Optimization
This isn’t just theory. Global stockouts cost businesses nearly $1 trillion in missed sales annually, while overstocking ties up billions in excess capital and inflates storage costs by 20-30%. For exporters and importers navigating GCC ports, shifting tariffs, and unpredictable demand in construction materials, petrochemicals, or FMCG, striking the right balance isn’t optional—it’s survival.
In this comprehensive guide, I’ll walk you through the real costs on both sides of the scale, proven frameworks to calculate your optimal levels, actionable strategies tailored to cross-border trade, and how smart operators are using data and tools to turn inventory from a liability into a competitive weapon. By the end, you’ll have a practical playbook you can apply immediately.
China’s Export Leadership: How Did It Scale to the Global Stage?
The Hidden Toll of Getting It Wrong: Stockouts vs. Overstocking
Let’s start with the pain points I’ve seen repeatedly in real deals.
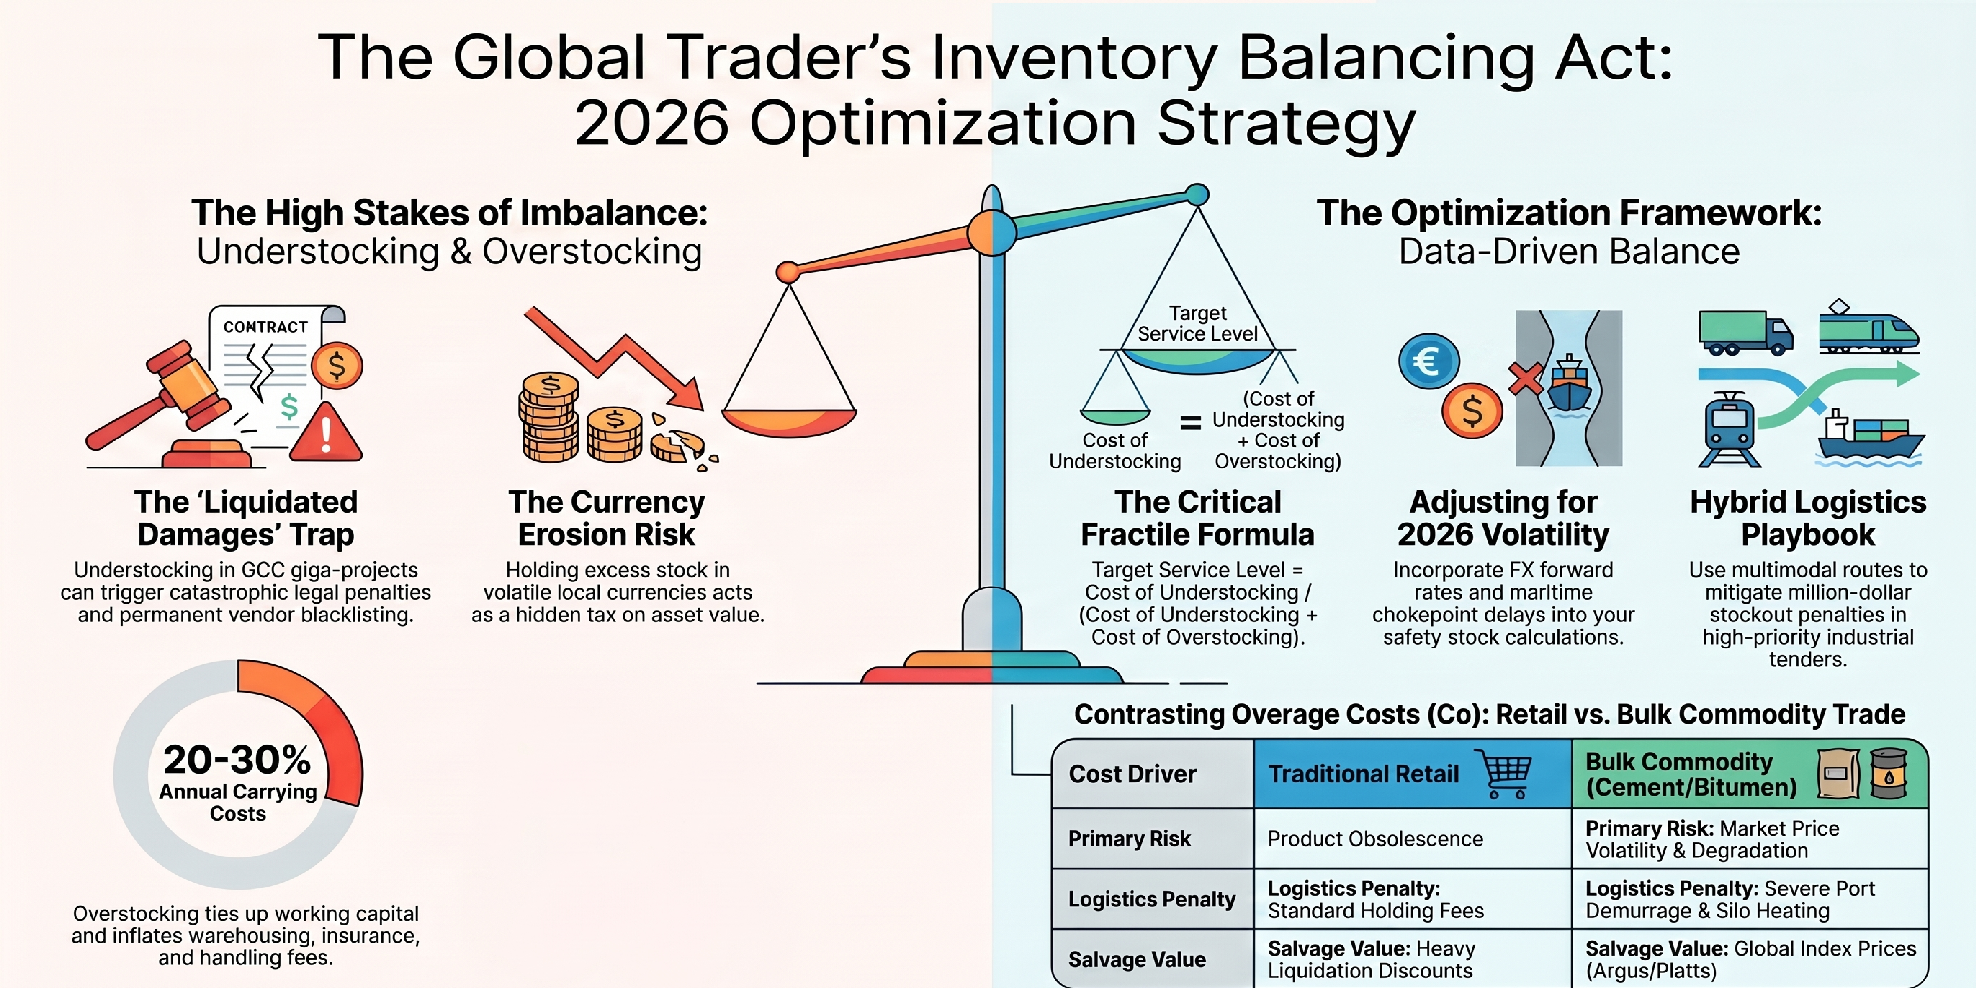
2026 Global Inventory Optimization Strategy
The Cost of Stockouts (Understocking)
When demand spikes and your shelves—or more likely, your containers—are empty, the damage goes far beyond lost immediate sales:
- Direct lost revenue: If you’re exporting bitumen or cement to reconstruction projects in Iraq or Saudi Arabia, a stockout can kill a multi-million tender. Customers don’t wait.
⚠️ Localization Risk: Giga-Projects & The “Liquidated Damages” Trap
When supplying infrastructure materials to Saudi Arabia’s Vision 2030 giga-projects (like NEOM, Red Sea, or Qiddiya) or critical reconstruction tenders in Iraq, the financial equation changes. In these high-stakes corridors, an understocking event (C_u) doesn’t just mean a missed sales margin—it can trigger catastrophic operational and legal liabilities.
1. Compounding Liquidated Damages (LDs)
Contractual penalties for supply delays in Saudi and Iraqi mega-projects are notoriously severe. Daily penalties can scale exponentially, meaning your cost of understocking (C_u) must include potential court/arbitration damages, completely shifting your critical fractile ratio.
2. Corporate Blacklisting & Relationship Death
Government and semi-government developers maintain strict vendor rating systems. A single major stockout that halts a multi-billion dollar construction timeline will land your company on a permanent regional blacklist, locking you out of future tenders.
The Regional Rule of Thumb: When exporting to GCC infrastructure operations, artificially inflate your C_u calculation by adding expected contractual penalties. This math forces a more aggressive, safety-oriented stock level that protects your market share.
- Lost customer lifetime value: In B2B trade, relationships are everything. One delayed shipment can push a buyer to a more reliable supplier permanently.
- Brand and reputation hit: Repeated issues erode trust, especially in markets where reliability signals professionalism.
- Opportunity costs: Rush shipping, expedited freight, or airlifting goods skyrockets expenses.
Studies show stockouts can reduce annual revenue by 2-10% or more in retail and wholesale, with global impacts in the trillions when scaled. In global trade, add in demurrage risks, customs delays, and geopolitical disruptions, and the multiplier effect is brutal.
The Drag of Overstocking
Holding excess inventory feels safe—until the storage bills, insurance, and obsolescence risks pile up:
- Carrying costs: Typically 20-30% of inventory value annually, covering warehousing, handling, insurance, and capital tied up.
- Obsolescence and spoilage: For perishables like food or seasonal goods, or tech-sensitive items, this is deadly. Even durable goods like machinery parts face depreciation.
- Reduced agility: Capital locked in stock limits your ability to pivot to new opportunities or hedge against currency fluctuations.
- Opportunity cost: That money could be invested in marketing, expanding product lines, or securing better supplier terms.
Average businesses hold around $142,000 in excess inventory, directly impacting cash flow and profitability.
The key insight? These aren’t equal opposites. The optimal point depends on your specific costs, margins, and market volatility. Understanding the “why” behind the imbalance is where experienced traders gain their edge.
Why the Balance Matters More Than Ever in 2026 Global Trade
Volatility is the new normal. Tariffs shift, supply routes face disruptions, demand in Vision 2030 projects fluctuates, and buyers expect just-in-time reliability. Poor inventory decisions amplify every external shock.
From my experience, companies that master this balance enjoy:
- Higher service levels without proportional cost increases.
- Better cash flow for seizing arbitrage opportunities.
- Stronger negotiating power with suppliers and buyers.
- Resilience against black-swan events like port congestion or regulatory changes.
Core Framework: The Newsvendor Model Adapted for Trade
One of the most powerful mental models is the classic Newsvendor (or Newsboy) problem, adapted brilliantly to modern supply chains.

The Newsvendor Model
Critical Fractile Formula: Critical Fractile = Cost of Understocking (Cu) / (Cost of Understocking (Cu) + Cost of Overstocking (Co))
This ratio tells you the service level (probability of meeting demand) you should target. If Cu is high (high margins, strategic products), stock more aggressively. If Co dominates (perishables, high storage), lean harder.
Step-by-Step Calculation for Your Business:
- Quantify Cu (Underage Cost): Lost profit per unit + goodwill loss + expediting costs. For a high-margin machinery part, this might be substantial.
- Quantify Co (Overage Cost): Purchase cost – salvage value + holding costs per period.
- Forecast Demand Distribution: Use historical data, market intelligence, and tools for probabilistic forecasting.
- Determine Order Quantity: Find the point on your demand curve corresponding to the critical fractile.
💱 The De-dollarization & Local Currency Volatility Factor
In the current global trade landscape, overstocking carries a severe, hidden risk beyond physical warehousing fees: Currency Exposure. As de-dollarization trends accelerate and macro trade settlements increasingly shift toward local currencies across the GCC, MENA, and Indian markets, holding static inventory means speculating on currency values.
Impact on Overage Cost (C_o)
If you are holding excess stock in a market experiencing local currency depreciation against your purchasing currency, the real asset value erodes every single day. Currency hedging costs must be added directly to your annual carrying costs.
Impact on Underage Cost (C_u)
When a local currency strengthens or a sudden regional arbitrage opportunity opens up (e.g., in UAE dirhams or Indian rupees), a stockout doesn’t just mean a missed sale—it means missing a high-value macro conversion window.
The Framework Adjustment: When calculating your Critical Fractile, the salvage value used in your C_o equation must be adjusted dynamically based on FX forward rates if your cross-border trade spans over multiple settlement months.
For bulk commodities like wheat or cement in Gulf trade, incorporate lead times, sea freight variability, and customs clearance buffers into the model.
🏗️ Adapting Newsvendor for Bulk Commodities (Non-Perishable)
The classic Newsvendor model assumes your products become obsolete or worthless if unsold (like fashion or fresh food). But when dealing with bulk commodities like Bitumen, Cement, or Wheat, the goods don’t vanish. Instead, your Overage Cost (C_o) undergoes a complete structural shift, driven by industrial and macroeconomic real-world metrics.
| Cost Driver | Traditional Retail Model | Bulk Commodity Reality |
|---|---|---|
| Overage Cost (C_o) | Full purchase price minus a minor scrap/salvage value. | Market price volatility risk + compounding storage fees + potential bulk degradation. |
| Logistics Penalty | Standard warehouse holding cost. | Severe port demurrage, container detention fees, and specialized silo/tank heating costs. |
| Salvage Value (V) | Heavy discounts or liquidation prices. | Highly dependent on the global index (e.g., Argus for bitumen, LME/Platts for metals). |
The Commodity Adjustment: When calculating Critical Fractile for bulk goods, do not set salvage value near zero. Instead, recalculate C_o as:
C_o = (Holding Cost) + (Demurrage Risk) + (Potential Index Price Drop)
Practical Strategies for Global Traders
📊1. The Financial Nexus: Trade Finance & Payment Terms
Inventory optimization cannot exist in a vacuum. Your optimal stock levels are fundamentally bound to your cash flow, and more importantly, how your international deals are financed. The choice of payment terms directly dictates your Working Capital Velocity and defines your risk of inventory stagnation.
Letters of Credit (L/C)
Provides transaction security but ties up credit lines. Requires precise inventory synchronization to avoid discrepancies, heavy demurrage, and cash-flow bottlenecks while goods are in transit.
Open Account / Usance
Accelerates the buyer’s cycle but shifts the entire holding cost and financing burden to the exporter. Demands a higher safety stock buffer to offset potential payment delays.
Pro Tip: When calculating your Overage Cost (C_o) in the Newsvendor model, always factor in the capital cost (interest rates/opportunity cost) of the money tied up during the specific financing window of the payment term.
2. Advanced Demand Forecasting
Move beyond gut feel. Integrate:
- Historical sales data.
- Market trends (e.g., infrastructure booms in GCC).
- External signals (commodity prices, geopolitical news).
- AI-powered tools for real-time adjustments.
3. ABC Analysis and Segmentation
Not all SKUs are equal:
- A items (high value, low volume): Tight control, frequent review.
- B items: Moderate.
- C items (low value): Simpler policies, higher safety stock tolerance.
In export portfolios, classify by margin, demand variability, and strategic importance.
4. Safety Stock Optimization
Safety Stock = Z-score × Standard Deviation of Demand × Lead Time Variability.
Factor in longer international lead times and multi-modal transport risks. Use tools to simulate scenarios.
🌐 Geopolitical Chokepoints & The 2026 Lead Time Crisis
In 2026, volatility along primary maritime corridors—especially the Red Sea and strategic regional straits—has fundamentally broken traditional lead-time predictability. Standard transit times are no longer static numbers; they are moving targets. Relying on historical averages to calculate safety stock is a direct route to either sudden stockouts or ruinous overstocking.
1. Redefining Lead Time Variance Standard Deviation of Lead Time
Smart operators in the GCC and MENA regions no longer use a single fixed lead time. They build dynamic buffers into their models to absorb sudden reroutings, port congestion, and customs bottlenecks caused by geopolitical shifts.
2. Embracing Multimodal Transport
Survival in 2026 demands a hybrid logistics playbook. When ocean freight through critical chokepoints spikes in risk or cost, top traders quickly pivot to cross-border land-bridge networks, combined sea-air routes, or alternative rail corridors to keep supply lines fluid.
Critical Tradeoff: Shifting to multimodal routes often increases your unit purchase/transport cost (C_o), but dramatically mitigates the multi-million dollar penalty costs of a stockout (C_u) in major infrastructure or industrial tenders.
5. Just-in-Time vs. Just-in-Case Hybrid
For stable routes (UAE re-exports), lean toward JIT. For high-uncertainty markets, build strategic buffers with clear triggers for release.
6. Supplier Collaboration and VMI
Vendor Managed Inventory or shared data platforms reduce your risk. Reliable partners on Tendify can help synchronize.
7. Technology Enablement
Leverage calculators for container optimization, cost analysis, and tariff impacts to inform inventory decisions. Real-time visibility into shipments prevents surprises.
ETA Planner Tool: Calculate Cargo Lead Time
Case Studies: Lessons from the Field
Consider a bitumen exporter to India. Overstocking led to quality degradation and demurrage hits. Switching to data-driven weekly adjustments using demand signals cut excess by 25% while maintaining 98% fill rates.
Or an importer of construction materials into Saudi projects: Frequent stockouts on key rebar sizes lost tenders. Implementing critical fractile-based planning with safety buffers secured more contracts without bloating warehouses.
These aren’t anomalies—top performers consistently reduce stockouts by 20-40% and overstock by similar margins through disciplined approaches.
Common Pitfalls and How to Avoid Them
- Ignoring hidden costs like goodwill.
- Static forecasts in dynamic markets.
- Siloed departments (sales vs. operations).
- Neglecting end-to-end landed costs including duties and logistics.
Regular audits and cross-functional reviews are non-negotiable.
Integrating Inventory Mastery with Broader Trade Operations
Effective inventory isn’t isolated. It connects to:
- Accurate HS code classification and tariff planning.
- Optimized logistics and container loading.
- Compliance checklists for smooth clearance.
- Market exploration tools for demand signals.
On Platform.Tendify.net, you can access integrated utilities like duty calculators, container optimizers, trade explorers, and more to feed better decisions directly into your inventory strategy. Checking these tools often reveals quick wins that improve your fractile calculations and reduce risks—well worth the few minutes to explore.
For deeper dives, see related resources on the blog like procurement management, logistics streamlining, and specific market guides.
Dried Egg Products: Egypt’s Masterstroke for GCC Trade Dominance
Building Your 2026 Inventory Playbook
- Audit current levels and calculate your actual Cu/Co.
- Implement segmentation and basic forecasting.
- Integrate digital tools for visibility.
- Set KPIs: inventory turnover, fill rate, carrying cost percentage.
- Review quarterly with scenario planning.
- Scale with AI for predictive edge.
Start small—one product category—and expand.
Turning Insight into Action
The difference between average and exceptional traders often comes down to this discipline. Those who treat inventory as a strategic asset rather than a necessary evil consistently outperform.
The platform at Platform.Tendify.net puts powerful, practical tools at your fingertips to support smarter inventory and trade decisions—from real-time calculators to market intelligence. Taking a moment to explore it could be the highest-ROI action you take this week for optimizing your operations.
What’s one inventory challenge costing you the most right now? Assess your Cu vs. Co, run the numbers, and take that first optimization step. Your cash flow—and your customers—will thank you.
Ready to level up your global trade operations? Join Tendify today and start connecting with verified partners while accessing the full suite of trade intelligence tools.

