Blog
India-China Trade Shift: Navigating the $76B Import Substitution
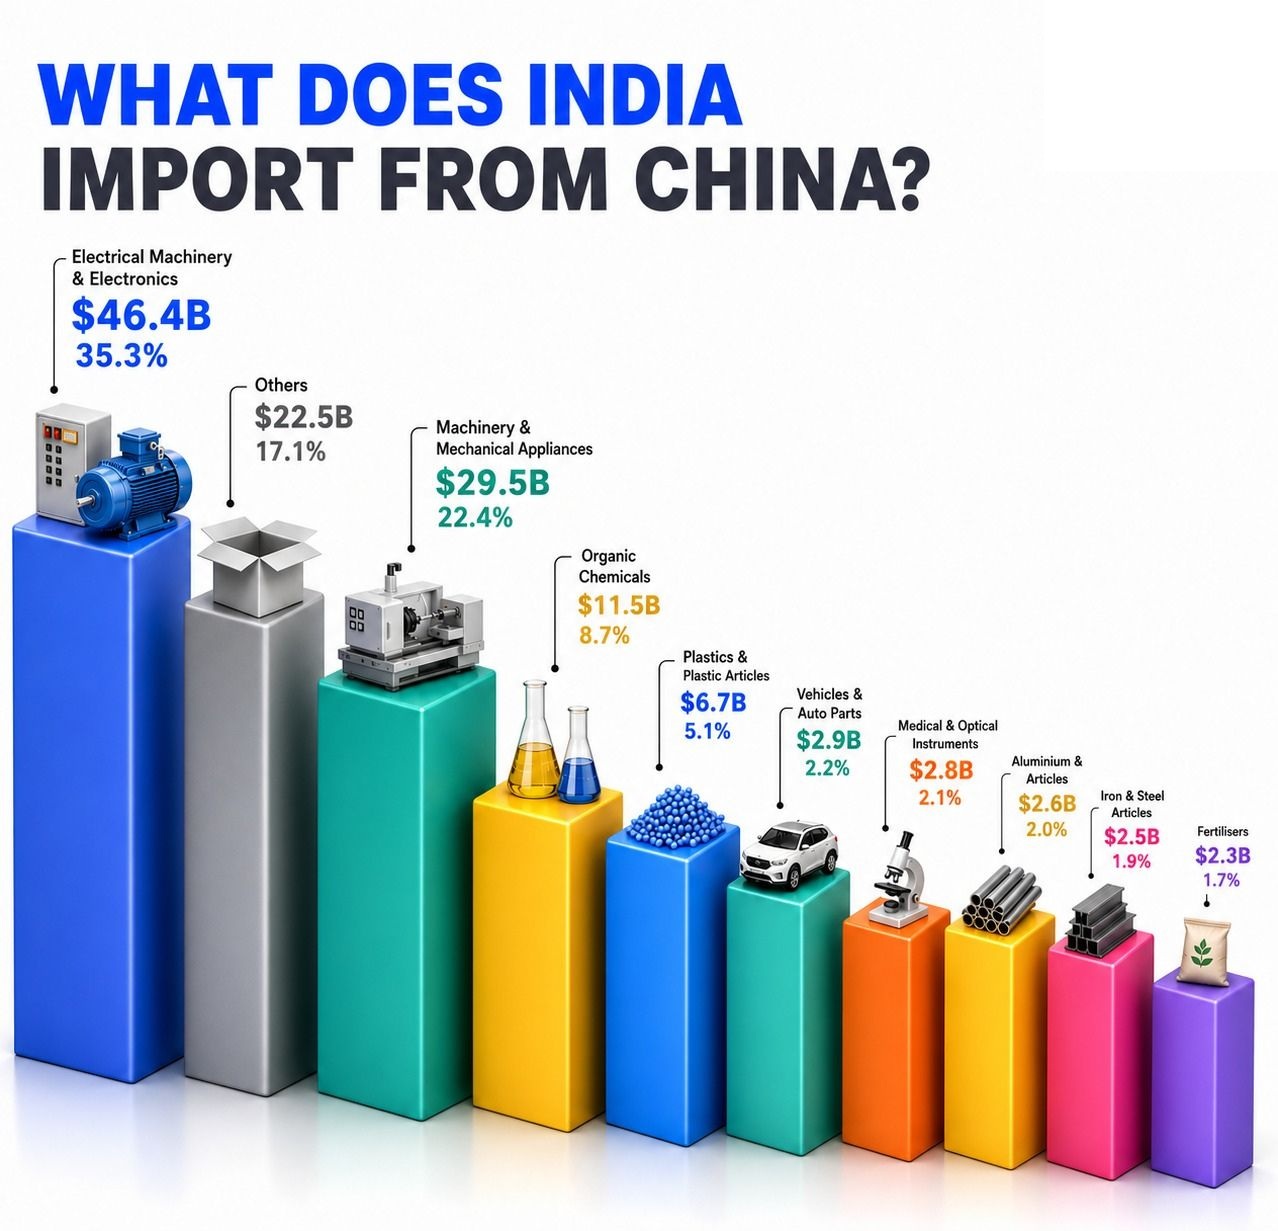
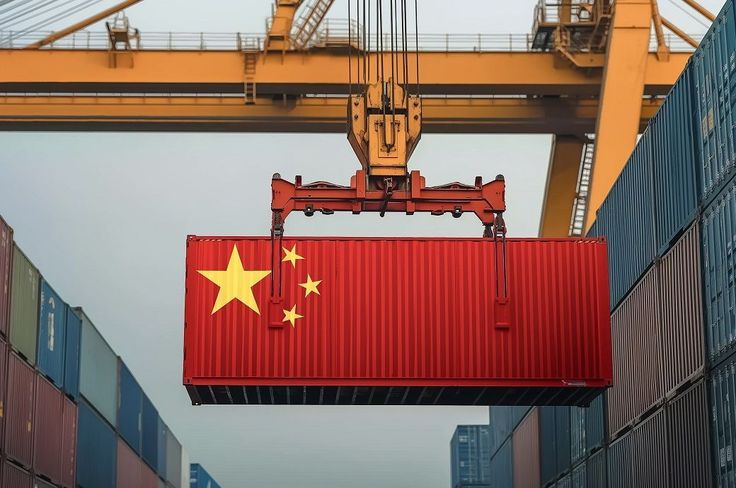
I’ve spent years navigating global supply chains, closing deals across volatile markets, and watching how dependency on any single source can quietly erode margins or expose entire operations to sudden disruptions. The numbers don’t lie: India imported roughly $132 billion worth of goods from China in FY26. While many picture cheap consumer goods, the reality is far more industrial. Electrical machinery and electronics alone hit about $46.4 billion (35%), with machinery and mechanical appliances adding another $29.5 billion (22%). Together, these categories represent nearly $76 billion in inputs that power India’s own manufacturing and exports.

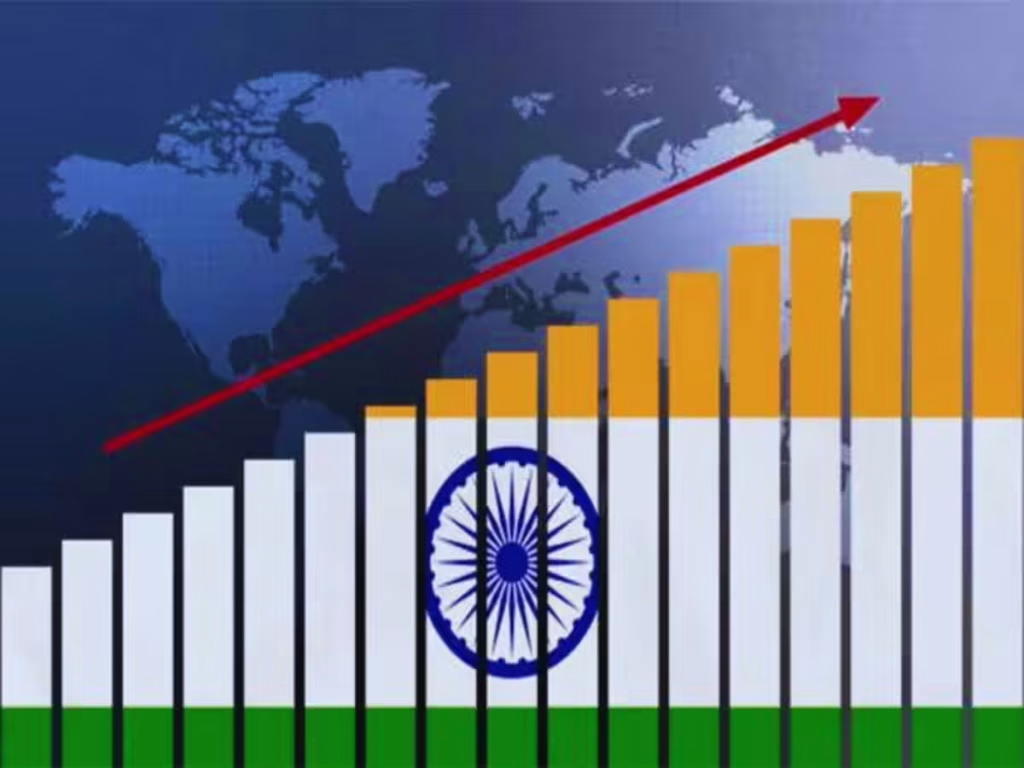
India-China Trade Shift
This isn’t just a trade imbalance—it’s a roadmap of opportunity. Every major industrial economy has gone through phases of heavy reliance on imported components before building domestic strength. The question isn’t whether India should reduce this dependency; it’s how smart traders, manufacturers, and investors can position themselves to capture the value as domestic production scales. In my experience, those who act early on import substitution don’t just cut costs—they build resilient, high-margin businesses that dominate regional and global markets.
CBM & Volumetric Weight Calculator for International Freight
India Export Map: Navigating State Clusters and Logistics
Why These Imports Matter More Than Most Realize
| Key Industrial Commodity Category | Import Value (FY26) | Share of Total Imports |
|---|---|---|
| Electrical Machinery & Electronics | $46.4 Billion | 35% |
| Machinery & Mechanical Appliances | $29.5 Billion | 22% |
| Organic Chemicals, Plastics & Intermediates | Significant Bulk Share | High Velocity |
| Total Targeted Import Pool | ~$76.0 Billion+ | ~57% |
India’s manufacturing sector isn’t standing still. Electronics and machinery imports fuel everything from mobile phone assembly to auto components, chemicals for plastics, and equipment for infrastructure projects. These aren’t luxury items; they’re the foundational inputs that keep factories running and exports flowing.
Key Categories Driving the Numbers:
- Electrical Machinery & Electronics: $46.4B — Components, semiconductors, telecom gear, and consumer electronics parts.
- Machinery & Mechanical Appliances: $29.5B — CNC machines, pumps, compressors, boilers, textile machinery, and industrial equipment.
The Velocity Play: Organic Chemicals & Plastics
While building domestic CNC machinery or semiconductor plants requires multi-year capital cycles, the Organic Chemicals and Plastics segment represents a high-velocity, fast-turnaround opportunity. Operating strictly as high-volume commodities, these materials feed into critical downstream sectors.
Directly powers global packaging, advanced polymer manufacturing, and agrochemical supply chains across the region.
Enables B2B traders to secure rapid margins through bulk sourcing, localized blending, and regional trade reallocation.
The “why” behind this reliance is straightforward: China has scale, established supply ecosystems, and cost efficiencies built over decades. But relying too heavily on any one partner creates vulnerabilities—geopolitical tensions, supply disruptions, currency fluctuations, and rising input costs. For forward-thinking businesses, this dependency signals where the next wave of value creation lies: localizing production where it makes strategic and economic sense.
The Shift Toward Import Substitution: Real Progress and Remaining Gaps
India has already made impressive strides through initiatives like the Production Linked Incentive (PLI) schemes. Mobile phone production surged from 5.8 crore units in 2014-15 to 33 crore in 2023-24, with exports climbing sharply and imports dropping dramatically in some segments. Telecom products saw around 60% import substitution in key areas. Similar momentum is building in pharmaceuticals, auto components, white goods, and solar modules.
India’s Trade Shift: China Overtakes US
Yet gaps remain, especially in high-precision machinery, specialized chemicals, and advanced electronics components. Full self-sufficiency isn’t the immediate goal—smart integration into global value chains is. The businesses thriving here are those that combine local manufacturing advantages (skilled labor, growing infrastructure, policy support) with strategic sourcing for what still needs to be imported.
Practical Insight: Import substitution isn’t about isolation. It’s about building competitive domestic capacity while using tools for efficient cross-border trade on the items you still source externally. This hybrid approach protects margins and accelerates growth.
Container Demurrage Calculator: Track Free-Time Costs
The Physical Reality: Logistics & Shipping Routes
While optimizing container utilization on a screen is vital, executing a resilient import substitution or diversification strategy requires a deep dive into the physical transit corridors connecting China, India, and the GCC. Modern B2B traders must actively map the hard realities of ocean freight volatility, shifting port congestion, and true transit times.
Balancing Shanghai/Ningbo to Nhava Sheva/Mundra lines against direct GCC routes like Jebel Ali.
Managing spot rate fluctuations and factoring in local terminal handling charges (THC) early.
Accounting for 14-21 day baseline ocean transits plus unpredictable customs and documentation bottlenecks.
Actionable Strategies for Manufacturers and Traders in 2026
Here’s what works based on real operations I’ve seen succeed:
1. Prioritize High-Impact Categories for Localization
Focus first on segments with strong domestic demand and policy tailwinds. Electronics assembly has proven the model—now extend it upstream to components and machinery parts. Use data-driven analysis to identify products where local production can achieve cost parity within 18-24 months.
2. Leverage Government Incentives and Free Zones
PLI schemes, tax benefits in special economic zones, and infrastructure development create clear entry points. Calculate total landed costs meticulously, including duties, logistics, and compliance. Tools like duty calculators and HS code finders become essential here to model scenarios accurately.
3. Build Resilient Supply Chains
Diversify suppliers while investing in domestic vendors. For critical inputs still coming from China or elsewhere, use platforms that offer transparency, verified partners, and secure payment options. In my experience, the biggest wins come from combining multiple sourcing origins with strong local fulfillment.
4. Master Compliance and Documentation Early
Customs valuation, tariffs, quality standards (like ASTM or BIS), and proper documentation separate profitable deals from costly delays. Proforma invoices, contracts, and checklists tailored to specific routes save time and reduce risks.
The Compliance Shift: HS Codes & Rules of Origin
Import substitution transforms more than your supply chain—it fundamentally alters the legal identity of your cargo. When you process imported sub-components into a finished domestic product, the transformation triggers a critical shift in compliance.
Tariff Heading Jumps (HS Transformation)
Moving upstream means converting raw inputs or electronics parts (e.g., Chapter 85 items) into integrated machinery. This clear change in the 4-to-6 digit HS Code level unlocks drastically lower outbound tariffs.
Securing Free Trade Access to GCC
To legally qualify for preferential duties under regional trade agreements (like India-UAE CEPA), substantial local value addition must be proven. Meeting these Rules of Origin requirements transforms your cargo into an official domestic export.
5. Use Technology for Competitive Edge
Modern trade isn’t manual. Real-time market intelligence, cost simulators, container optimization, and compliance checkers turn data into decisions. These tools help you spot arbitrage, optimize logistics, and stay ahead of regulatory changes.
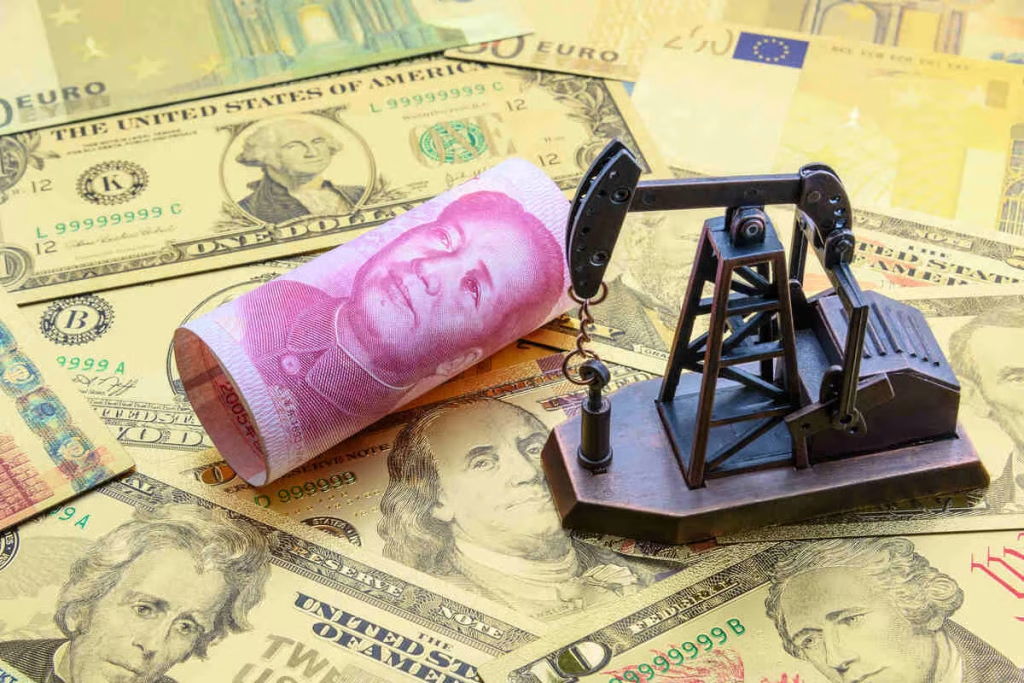
The Financial Engine: Trade Finance & De-dollarization in 2026
Shifting supply chains or scaling local manufacturing isn’t just a hardware challenge—it demands intensive working capital. Navigating global markets in 2026 requires smart cross-border financing and a keen eye on the rapid transition toward alternative trade settlements.
Local Settlement
Risk Mitigation
US-Iran Funds Deal: New Trade Opportunities for GCC Hubs
How Tendify Fits Into Your Import Substitution Playbook
Platforms built for practical global trade make this transition smoother. Whether you’re sourcing residual components, exporting finished goods, or connecting with verified partners across the GCC, India, and beyond, having integrated utilities for duties, tariffs, HS codes, contracts, and logistics planning is a game-changer.
Head over to Platform.Tendify.net to explore the command center—tools like the India Duty Calculator, HS Code Finder, Proforma Builder, Container Optimizer, and AI-powered market insights help you model costs, generate compliant documents, and execute faster. Many traders I’ve worked with report cutting evaluation time in half and avoiding common pitfalls that erode margins.
Challenges and How to Overcome Them
- Technology and Skill Gaps: Address through targeted training and partnerships with global tech providers.
- Quality Consistency: Invest in standards and testing from day one—buyers notice immediately.
- Financing and Scale: Use export finance options, escrow services, and phased scaling supported by incentives.
- Geopolitical and Currency Risks: Hedge with smart contract clauses and diversified routes.
The businesses that treat these as solvable engineering problems rather than barriers pull ahead.
The Gateway: Leveraging GCC Hubs for Global Re-Export
Reducing import dependency on any single source isn’t just a defensive play—it’s an offensive launchpad. By localizing manufacturing or assembling critical industrial inputs in India, smart operators gain a distinct geo-economic advantage when tapping into the Middle East.
Case Studies: Lessons from Successful Shifts
Look at India’s mobile phone ecosystem: From heavy importer to exporter, supported by PLI and ecosystem development. Similar patterns are emerging in solar, auto components, and pharmaceuticals. Companies that mapped their import bills, identified substitutable items, secured incentives, and built supplier networks have scaled rapidly.
Commodity-Driven Success: Beyond Electronics
The blueprint for import substitution isn’t exclusive to high-tech manufacturing. Significant, fast-moving shifts are transforming raw material processing and bulk commerce sectors, proving highly profitable for traditional B2B traders.
Pharmaceutical APIs
Export Packaging
In bulk commodities and machinery, traders using digital tools for cost analysis and compliance consistently outperform those relying on traditional methods.
Future Outlook for 2026 and Beyond
India’s macro trajectory is no longer just about meeting domestic demand; it is fundamentally about becoming a dominant, high-yield global manufacturing hub. Backed by sustained policy frameworks, aggressive multi-modal infrastructure investments, and a dynamic entrepreneurial ecosystem, the $76 billion import pool across machinery, chemicals, and electronics is actively transforming. This massive capital outflow is reshaping into robust domestic production capacity, turning traditional importers into formidable global exporters.
For forward-thinking traders, industrial manufacturers, and supply chain strategists, this systemic shift creates a highly lucrative landscape characterized by three core pillars:
Defensive Resilience Against Single-Source Vulnerabilities: By cultivating diversified, localized vendor networks, businesses are systematically shielding their operations from geopolitical choke points, ocean freight rate spikes, and sudden unilateral trade barriers.
Exponential Value Capture Through Localization: Moving upstream from basic assembly to component-level manufacturing allows enterprises to lock in higher margins, capitalize on localized R&D, and benefit from aggressive domestic tax incentives and manufacturing free zones.
Offensive Positioning in High-Growth Corridors: Products bearing a verified Indian origin are increasingly gaining a competitive edge in the GCC, East Africa, and Central Europe. By integrating with regional logistics strategies like the Dubai Economic Agenda D33, smart operators can use Middle Eastern hubs as premier re-export nodes to capture underserved international markets.
The tactical window of opportunity is open right now, but it will not remain open indefinitely as markets consolidate. The leaders of this next industrial phase will be the ones who proactively audit their import exposure, isolate high-velocity categories like organic chemicals and specialized parts, and ruthlessly equip their operations with real-time digital trade intelligence. Staying ahead of regulatory shifts, mastering HS code transformations, and optimizing transactional landing costs are no longer optional—they are the core engineering metrics that will define global trade success in 2026 and far beyond.
Your Next Steps: Turn Insight into Action
Start by auditing your own import profile. Identify the top 5-10 items contributing most to your costs. Model localization or diversified sourcing scenarios using reliable calculators. Generate professional documentation and connect with verified partners.
The shift from heavy importer to balanced, competitive manufacturer is happening. Smart operators aren’t waiting—they’re building the capabilities today that will define success tomorrow.
Ready to streamline your trade operations? Explore Platform.Tendify.net and access the full suite of trade engines, calculators, document builders, and market intelligence designed for exactly these challenges. Whether you’re optimizing duties on machinery imports, preparing compliant contracts, or finding new supply routes, the tools are there to help you execute with confidence.
Sign up today and take the first step toward more resilient, profitable global trade in 2026 and beyond. Your next competitive advantage is one platform away.